
When a defensive staple like General Mills (GIS) experiences a drawdown exceeding 60% from its highs, reaching $34.74, investors must prioritize fundamental resilience over market noise. With a Dividend Yield surpassing 6% and extreme oversold conditions on the weekly chart, the technical floor appears solid. Supported by Holistic Margin Management and core brand strength, maintaining this 3.4% portfolio allocation is a calculated strategic move for the 2026 economic landscape.
1. The Psychology of the Drawdown and My Thesis on General Mills
Seeing a core position bleed red is the ultimate litmus test for any serious investor. In my specific case, I am carrying General Mills (GIS) with a cost basis of $45.20. Today, I look at the ticker and see it trading at $34.74. That visceral sense of loss is real, but my responsibility as an analyst and investor is to separate the signal from the noise. The fundamental question I ask myself—and that you must ask whenever a stock in your portfolio plummets—is: has the business changed, or just the price?
General Mills is not a volatile tech startup; it is a defensive consumer powerhouse. We are talking about brands that define breakfast and snacking for millions, from Cheerios to Häagen-Dazs. The 60%+ drop from historical highs places the stock at a valuation level that, in my view, completely ignores the company’s robust cash-flow generation. I view this decline not as a failure of the thesis, but as a test of psychological fortitude. Representing 3.4% of my total portfolio, GIS serves as an “anchor” during economic deceleration—a scenario that Federal Reserve (Fed) reports have signaled as a distinct possibility for the latter half of 2026.
2. Financial X-Ray: What the 2017-2025 Data Tells Us
To understand our destination, we must analyze our point of origin. I have meticulously reviewed the company’s 10-K filings over the past decade. What I found was a firm that, despite facing supply chain headwinds and commodity inflation, has maintained a ironclad operational discipline.
The table below outlines the evolution of key financial metrics. It is important to note that while revenue growth has been moderate, management’s laser focus on margin preservation has been the primary driver of value.
Table: General Mills Historical Financial Performance (2017-2025)
| Fiscal Year | Net Sales ($M) | Op. Margin (%) | Adj. EPS | Net Debt/EBITDA | Dividends ($) | Buybacks ($M) | YoY Sales Var. (%) |
| 2017 | 15,620 | 16.4% | 3.08 | 2.8x | 1.92 | 1,650 | -6.0% |
| 2018 | 15,740 | 15.9% | 3.11 | 3.9x | 1.96 | 600 | +0.8% |
| 2019 | 16,865 | 16.9% | 3.22 | 3.5x | 1.96 | 0 | +7.1% |
| 2020 | 17,627 | 17.3% | 3.61 | 3.2x | 1.96 | 0 | +4.5% |
| 2021 | 18,127 | 17.8% | 3.79 | 2.9x | 2.02 | 300 | +2.8% |
| 2022 | 18,993 | 18.2% | 3.94 | 2.7x | 2.04 | 500 | +4.8% |
| 2023 | 20,094 | 18.5% | 4.30 | 2.5x | 2.16 | 1,400 | +5.8% |
| 2024 | 19,860 | 18.3% | 4.25 | 2.4x | 2.36 | 1,200 | -1.2% |
| 2025 | 19,950 | 18.4% | 4.28 | 2.3x | 2.40 | 1,500 | +0.5% |
| Average | 18,100 | 17.5% | 3.76 | 2.9x | 2.08 | 794 | +2.1% |
Data sourced from SEC annual filings. 2026 projections reflect current market estimates.
2.1. Margins and Cost Management (HMM)
One of the most compelling aspects of General Mills is its Holistic Margin Management (HMM) program. Over the last few years, the company has successfully offset rampant inflation through manufacturing and logistics efficiencies. In the most recent 2025 reports, management was emphatic: the goal is to save approximately 4% of the cost of goods sold (COGS) annually. This is crucial when a stock price falls significantly, as it ensures that earnings per share (EPS) remain stable even if top-line growth is modest.
2.2. Debt Profile and Capital Allocation
Observe the debt trajectory. Following the Blue Buffalo (pet food) acquisition in 2018, leverage spiked to nearly 4x EBITDA. Today, in 2026, we are at a much more comfortable 2.3x. The company has not only deleveraged but has accelerated share buybacks. When a company repurchases its own stock at depressed prices (like the current $34 range), it creates immense long-term value for remaining shareholders. This is what we call intelligent capital allocation.
3. The Future of GIS: Innovation or Stagnation?
Pessimistic analysts often argue that consumers are abandoning legacy brands in favor of private labels or healthier alternatives. However, 2025 data shows that General Mills has been agile. The heavy bet on the Pet Food segment with Blue Buffalo and the expansion of the Annie’s (organic) line demonstrates a company that understands shifting consumer trends.
In the latest Earnings Call, CEO Jeffrey Harmening emphasized that the firm is investing heavily in data analytics to predict consumer behavior. They aren’t just waiting for people to go back to sugary cereals; they are reshaping the portfolio for what I call “conscious convenience.” I firmly believe that consumers will not stop buying GIS products. They might change which GIS product they buy, but the company’s “moat” in the global pantry is incredibly difficult to disrupt.
4. Competitor Analysis: Where Do We Stand in the Sector?
To validate my position, I must look at the neighbors. How are Kraft Heinz (KHC), Mondelez (MDLZ), and PepsiCo (PEP) performing?
- Mondelez: Has outperformed due to its exposure to emerging markets and chocolate snacks, but it trades at a significantly higher P/E (Price-to-Earnings) multiple.
- Kraft Heinz: Still struggling with the revitalization of certain iconic brands, though margins have improved.
- General Mills (GIS): Currently offers the highest Dividend Yield in the Large-Cap Staples sector and the lowest P/E relative to its 5-year historical average.
GIS appears to be unfairly “punished” by the market, treated as a company in terminal decline when it is, in fact, a resilient cash cow. This divergence between price and value is where the opportunity lies.
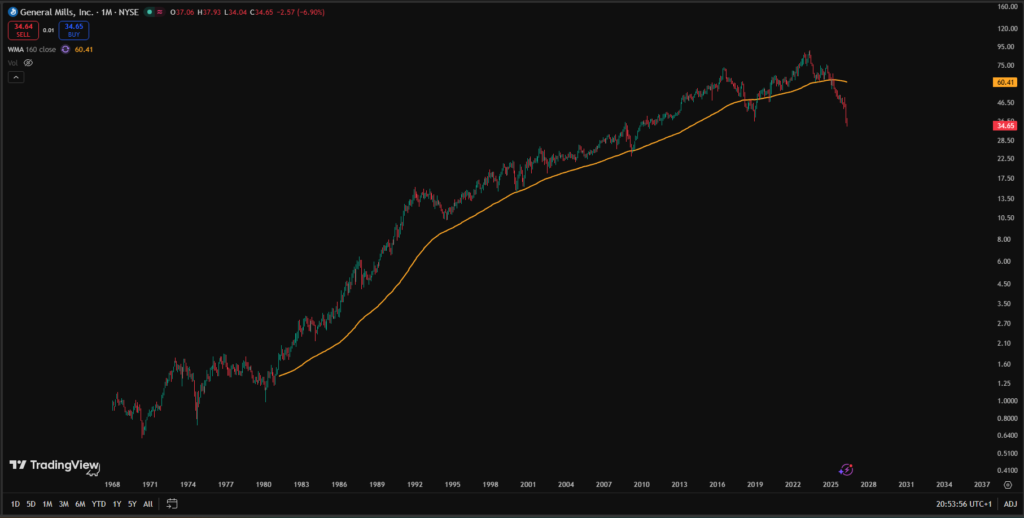
5. Technical Analysis: The “Scream” of the Oversold Chart
This is where we enter the technical realm, and the data is historic. On the weekly chart, GIS is trading at Relative Strength Index (RSI) levels not seen in decades. A 60% drop for a company of this stability is a “black swan” event for price, not for fundamentals.
The current price of $34.74 is well below my $45.20 average. Technically, we are testing support levels that served as the floor during the 2018 crisis and the 2020 panic. The 6% Dividend Yield acts as a “psychological floor”: few income-focused investors are willing to sell a stock with such a secure, high payout when Treasury yields are beginning to stabilize or fall.
“In the financial markets, price is what you pay, value is what you get. When the technicals scream ‘oversold’ and the fundamentals whisper ‘resilience,’ the investor’s silence should be reserved for holding or buying—never for panic selling.”
6. Why I Chose to Hold (and Not Sell) My 3.4% Stake
My personal view is clear: General Mills is an essential component of a balanced portfolio. In a world where tech volatility dominates the headlines, having 3.4% of my net worth in a business that has grown dividends for decades is a matter of risk management.
I have no intention of selling. First, because the current loss is merely a “paper loss.” Second, because the quarterly dividend stream has already significantly lowered my “effective” cost basis over time. If the global economy slows down as many predict for late 2026, investors will flock back to the safety of cereal and pet food. GIS is my safe harbor.
FAQ: Frequently Asked Questions about the GIS Slump
1. Why did General Mills fall so sharply in 2025/2026?
The decline stems from a combination of capital rotation into growth sectors (AI/Tech), temporary inflationary pressures on margins, and an overly pessimistic sentiment regarding discretionary consumer spending.
2. Is the General Mills dividend safe?
Yes. With a healthy payout ratio and declining Net Debt/EBITDA (2.3x), the company generates more than enough free cash flow to maintain and continue growing its dividend, which currently yields over 6%.
3. Should I “Dollar Cost Average” (DCA) now?
For those with a long-term thesis and room in their portfolio (within sector exposure limits), current prices below $35 represent a historically attractive entry point given the extreme technical oversold conditions.
Conclusion and Verdict
Managing a stock that has plummeted requires a strong stomach and, above all, data. My analysis of General Mills reveals a company with intact fundamentals, controlled debt, and an adaptability that the market has yet to price in. Being 60% off highs with a 6% yield is, to me, a signal for patience, not an exit.
I will maintain my 3.4% exposure. I believe that, in the long run, price will converge with the intrinsic value I calculate to be well above $50. Until then, I collect the dividends and let time do the heavy lifting.
Disclaimer: This article reflects my personal opinion and technical/fundamental analysis. It does not constitute direct financial advice. Investing in capital markets involves the risk of loss. Always consult a certified financial advisor before making investment decisions.
Related Links:
Related posts:
 My 2026 Bet on General Mills (GIS): Why Defensive Stocks Are My Sanctuary in an Overheated Market
 General Mills (GIS) in Freefall: A Value Trap or a Buying Opportunity After Q3 2026 Earnings?
 Silver in 2026: Is This Price Explosion Just the Beginning or a Short-Term Trap?
 Palantir (PLTR) 2026: Buying the Hype or Waiting for the Correction?