
In February 2026, the Bitcoin crash was confirmed as the market entered a bearish regime shift after breaching the primary ascending trendline established in 2022, validating a massive triple bearish divergence on the weekly RSI. The current formation of a daily bear flag projects technical targets between $60,000 and $70,000. Concurrently, Truflation data (0.86%) signals imminent systemic deflation, likely forcing a Fed pivot. I anticipate Bitcoin will front-run equity indices in a recovery by mid-2026, driven by AI-led productivity gains and consumer deleveraging.
I have always maintained that markets do not move in a straight line, and what we witnessed this weekend was the materialization of a warning that the charts have been flashing for months. The Bitcoin crash currently unfolding is not a random event or an unpredictable “black swan”; rather, it is the logical conclusion of deep technical exhaustion combined with a macroeconomic backdrop that many choose to ignore. I saw this movement taking shape since Bitcoin began struggling to maintain its vital support levels, and today, with blood in the digital streets, I feel compelled to share my raw, technical perspective on what comes next. Bitcoin has broken structures that stood for years, and ignoring this fact is the most expensive mistake an investor can make right now.
1. The Anatomy of a Disaster: Breaking the 2022 Trendline
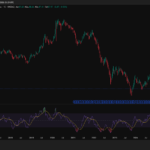
To understand the gravity of the current situation, we must look at the weekly timeframe. Since the 2022 bottom, Bitcoin has been carving out a resilient upward trajectory—a trendline that served as the backbone for the entire risk-on market. However, technical analysis is unforgiving: when a trendline spanning more than three years is broken on significant volume, the market regime has fundamentally changed. This weekend, we saw that definitive break. But the most alarming signal wasn’t just the price action; it was the triple divergence on the weekly RSI.
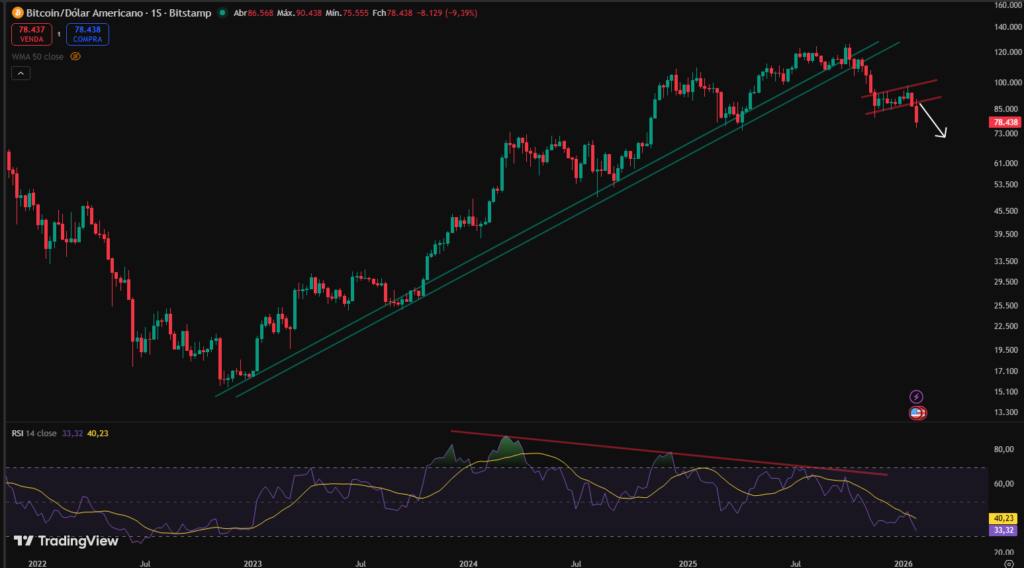
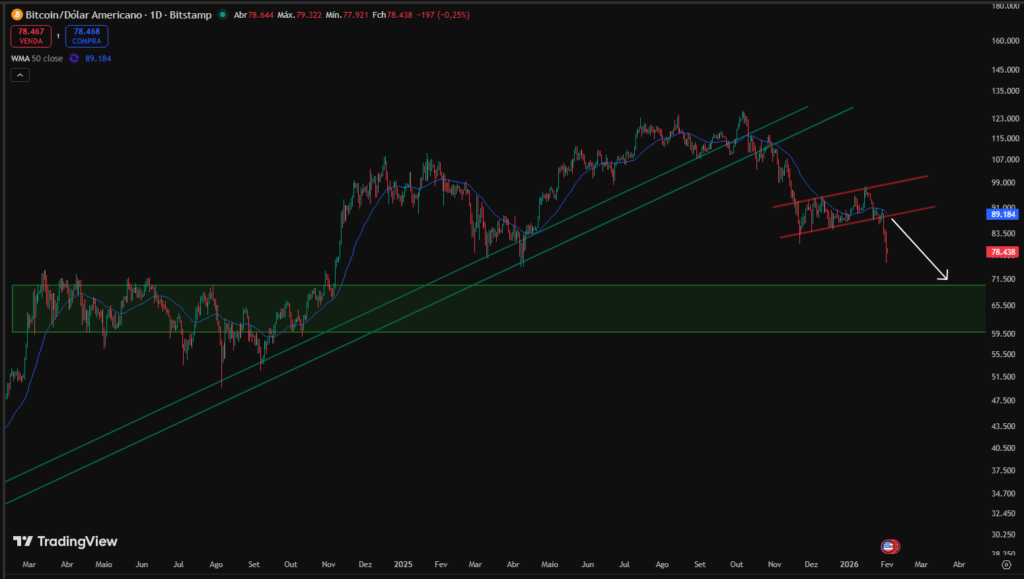
While price was desperately attempting to print new highs, the Relative Strength Index (RSI) showed glaring weakness, making successively lower peaks. This divergence is historically one of the most reliable indicators that smart money is distributing positions while retail investors continue to buy the euphoria. The breach of the trendline was merely the trigger. Following an initial violent drop, the market attempted a technical bounce that resulted in a bear flag formation, perfectly visible on the daily chart. As we know, bear flags are continuation patterns, and the downward resolution of this pattern now points toward support levels we haven’t visited in quite some time.
2. The Technical Target: The $60,000 to $70,000 Value Zone
Many are asking me: “Where is the bottom?” In financial markets, catching a falling knife is a fool’s errand, but we can identify high-probability zones through historical support and Fibonacci levels. Based on the bear flag projection and the liquidity clusters accumulated in previous cycles, my prediction is clear: we will see Bitcoin oscillate between $60,000 and $70,000. This is the “Golden Zone” where final capitulation is likely to occur and where the “weak hands” will finally be shaken out of the market.
I have no intention of buying yet. My plan is rigorous: I will only consider accumulating assets again when the charts begin to print green Heikin Ashi candles on the weekly timeframe, confirming that selling pressure has been exhausted. As I detailed previously in my Bitcoin DCA strategy, the secret to longevity in this market is not being constantly positioned, but knowing when to enter with the highest probability on your side. Entering before this confirmation is gambling; entering after a Heikin Ashi reversal is trading a validated trend.
3. The Macro Backdrop: Deflation, AI, and the 2026 Fed Pivot
Beyond the charts, we must look at the macroeconomic fundamentals shaping this year. Looking at the latest data from Truflation, we see a staggering figure of 0.86%. This is, for all intents and purposes, the doorstep of systemic deflation. While the Federal Reserve (Fed) and the ECB continue to monitor lagging indicators, real-time data measured by on-chain oracles shows that prices are collapsing on the ground.
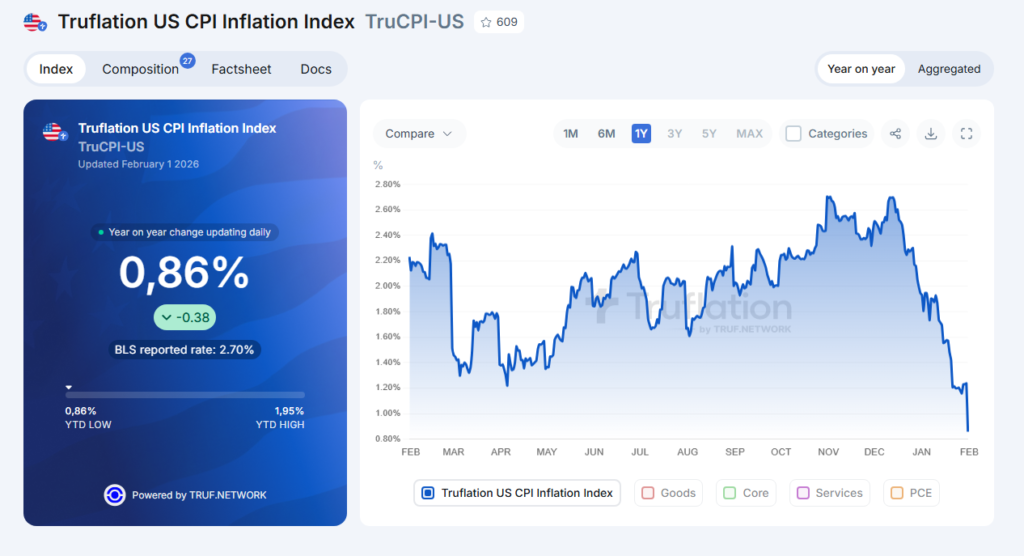
| Indicator | Current Value (Feb 2026) | Trend | Impact on Bitcoin |
| Truflation US CPI | 0.86% | Sharp Decline | Highly Bullish (Mid-Term) |
| Fed Funds Rate | 4.25% (Est.) | Hold/Cut | Pressure for Pivot |
| Consumer Spending | Low | Over-indebtedness | Temporary Asset Liquidation |
| AI Adoption | Deflationary | Accelerating | Productivity Shock |
Why are we seeing this deflation? Two fundamental reasons. First, the massive integration of Artificial Intelligence across all economic sectors has generated productivity gains so drastic that the cost of producing goods and services is plummeting. Second, consumer over-indebtedness has reached a breaking point. The public simply no longer has the capacity to consume; credit is tapped out. This scenario is toxic for risk assets in the short term, as it forces the liquidation of positions to cover debts, but it is the perfect fuel for a radical shift in monetary policy.
4. The Mid-Term Roadmap: Bitcoin Leads the Recovery
Although the current outlook appears grim, I stand by my thesis presented in the 2026 Midterm Roadmap. Historically, Bitcoin has a unique ability to front-run traditional indices like the S&P 500 or the Nasdaq. I predict that Bitcoin will find its floor and begin to recover well before the traditional stock markets.
This will likely happen around mid-2026, at the exact moment the Fed is forced to admit that the economy is entering a dangerous deflationary spiral. Once interest rate cuts begin to be injected back into the system, liquidity will first seek out the most scarce and technologically advanced asset in the world. Bitcoin is not just a store of value; it is an insurance policy against central bank incompetence in managing the transition to an AI-driven economy.
5. Frequently Asked Questions (FAQ)
Will Bitcoin drop below $50,000?
While unlikely due to strong institutional and psychological barriers, a drop below $60,000 would likely only occur in the event of a systemic banking collapse. The $60k-$70k zone remains my primary long-term support.
Why use Heikin Ashi candles for buying?
Heikin Ashi candles filter out market noise and show trend direction with greater clarity. By waiting for a green candle, I avoid entering “bull traps” during a persistent downtrend.
Is deflation bad for Bitcoin?
In the short term, deflation can cause sell-offs due to a “dash for cash.” However, it eventually forces Central Banks to print money and lower rates, which historically is the greatest catalyst for Bitcoin’s explosive growth.
How is AI impacting crypto prices?
AI is reducing costs deflationarily. This frees up capital in the long run, but initially causes unemployment and reduced consumption. Bitcoin benefits by being a neutral, non-manipulatable currency in this new technological paradigm.
Conclusion: Discipline Over Emotion
Conclusion: Discipline Over Emotion
We are at a defining moment. This weekend’s crash cleared out excess leverage and brought technical reality back to the forefront. I remain firm in my stance: there is no rush to buy. I will patiently observe the $60,000 – $70,000 zone, monitoring Truflation data and waiting for visual confirmation on my charts.
Financial markets reward patience and punish impulsivity. If the deflationary scenario holds and the Fed capitulates, Bitcoin will be the first to take flight. Until then, protect your capital, study the technical levels, and do not be swayed by media panic. You can monitor the evolution of monetary policy decisions directly on the Federal Reserve official website to confirm if the pivot I anticipate is gaining traction. The roadmap for 2026 is set; the only question is whether you have the discipline to follow it.
Disclaimer: The views expressed in this article are solely those of the author and do not constitute financial advice. Investing in crypto-assets involves a high risk of capital loss. Always perform your own research before making any investment decisions.
Related posts:
 The Dollar Paradox of 2026: Why Falling Rates Will Skyrocket the DXY (And How I’m Positioned)
 Why I Am Long VIX in 2026: Buying the Insurance Policy No One Wants
 TLT: Why Deflation and the Greatest Short Squeeze in History Could Create the Opportunity of a Lifetime in U.S. Treasuries
 Trading Portfolio January 2026: +11.8% Growth and My High-Conviction Bet on the Dollar Paradox