As of January 2026, the S&P 500 is trading at a dangerously stretched Forward P/E of 22.0x, far exceeding its 30-year historical average of 17.1x. Despite prevailing market euphoria, technical indicators and VIX term structure (Volatility) suggest an imminent mean reversion. I am strategically positioned Long VIX to capitalize on Q1 seasonality and looming macro catalysts—including the Japanese debt crisis and geopolitical friction—targeting an exit at the 30 level.
It is mid-January 2026, and the atmosphere on Wall Street is one of almost palpable euphoria. Investors are intoxicated by double-digit earnings growth projections and the relentless momentum of AI-driven productivity. However, for those of us who analyze markets through the lens of cold, hard data rather than retail sentiment, the current landscape is one of extreme fragility masked by deceptive price action. I have recently initiated a significant long position in the VIX—the market’s “fear gauge”—within my private trading portfolio. This isn’t a “doomsday” bet; it is a calculated, asymmetrical trade based on statistical probability and the inevitable return of volatility. In 2026, the real opportunity isn’t chasing the rally; it’s owning the insurance while it’s still cheap.
It is crucial to emphasize that the data and graphical projections presented throughout this analysis—ranging from valuation multiples to return scatter plots—are based on JPMorgan (JPM) institutional research reports, providing the necessary rigor and robustness to sustain this market thesis.
1. The Valuation Trap: S&P 500 at 22x Forward Earnings
The first pillar of my thesis is the absolute disconnect between fundamentals and current market pricing. Historically, the S&P 500 has found its “gravity” around a Forward P/E (Price-to-Earnings) ratio of 17.1x. Today, we are paying 22.0x. We are essentially paying a massive premium for earnings that have yet to materialize in an environment where the “easy money” has already been made.
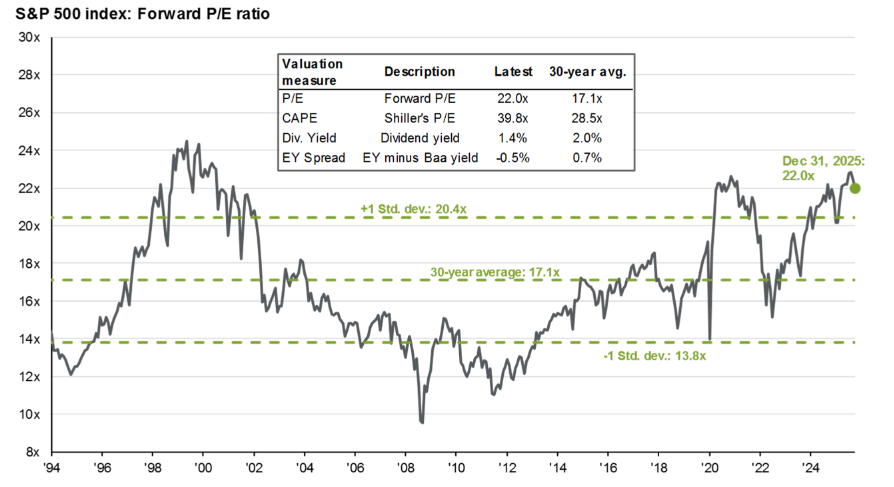
When we look at historical valuation cycles, every time the market has sustained multiples above 21x, the subsequent 12-month returns have been either mediocre or sharply negative. I am not suggesting the market is going to zero—in fact, I believe the secular primary trend remains intact—but the risk-to-reward ratio for being long equities at these levels is abysmal. By going Long VIX now, I am purchasing protection at a time when the market consensus believes “tail risk” has been permanently deleted from the financial dictionary. This is a classic mean reversion play that most investors ignore until the correction is already underway.
Comparative Data: Valuation Cycles vs. Volatility Levels
| Period/Era | S&P 500 Forward P/E | Average VIX Level | Underlying Macro Event |
| 30-Year Average | 17.1x | 19.5 | Historical Equilibrium |
| Dot-com Bubble (2000) | 24.5x | 25.0 | Tech Overextension |
| Pre-2022 Correction | 21.4x | 16.5 | Inflationary Pivot |
| January 2026 (Current) | 22.0x | 17.8 | AI Concentration & Debt Peaks |
2. VIX Seasonality and the Myth of the “Perpetual Bull”
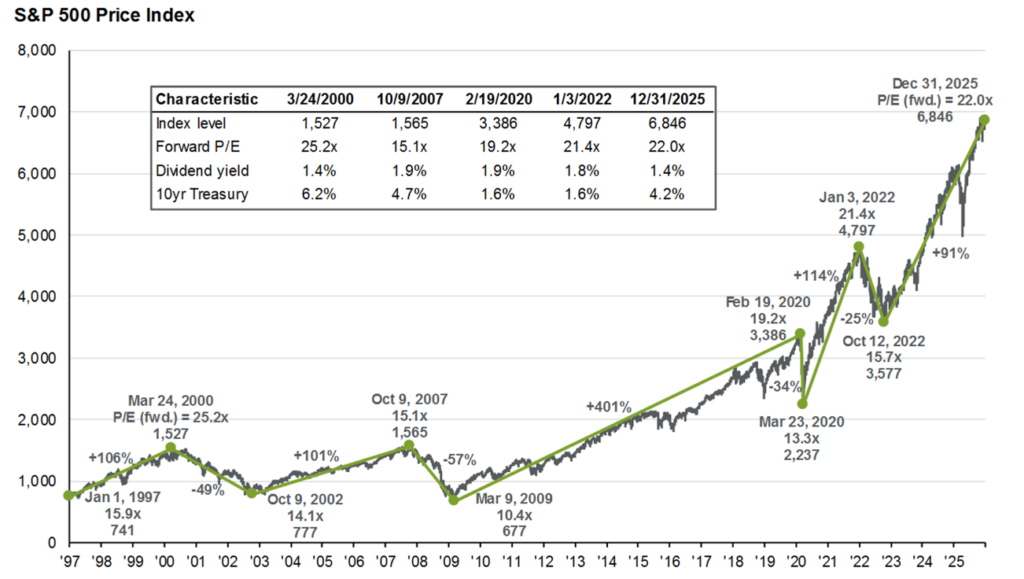
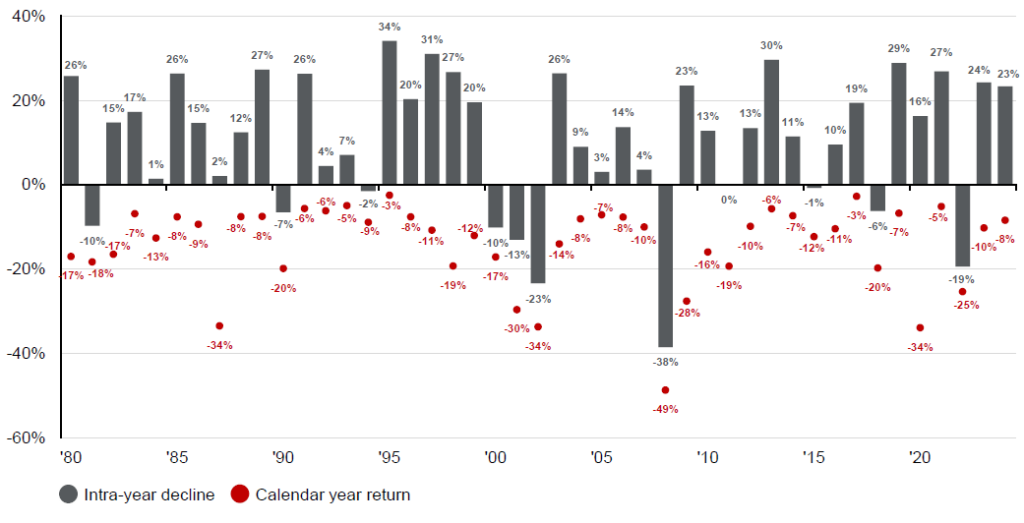
Retail investors often suffer from “recency bias,” looking at a yearly chart and seeing only a green line moving up and to the right. They conveniently forget that even in the strongest bull years, the S&P 500 suffers an average intra-year drawdown of approximately 14%. Entering 2026, we are starting from a point of extreme optimism, which makes any minor disappointment a massive catalyst for a volatility spike.
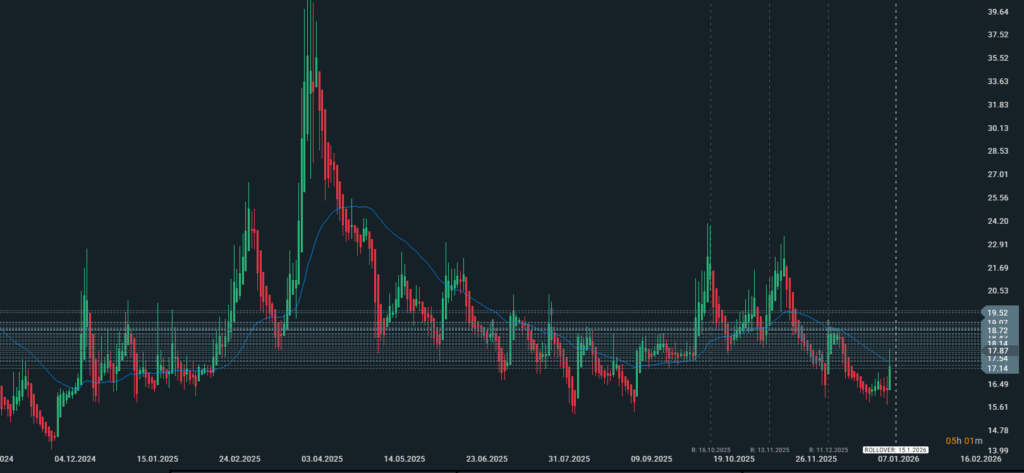
Historically, VIX seasonality is highly favorable for long positions in the first quarter. After the artificial suppression of volatility during the “Santa Claus Rally” in December, January often brings a “reality check” as institutional players rebalance and hedge for the year ahead. I look at the VIX chart and see a solid base being built, a “coiling spring” ready to snap. As the legendary trader Bruce Kovner once implied: “Show me the chart, and I’ll tell you the news.” The chart is telling me that a volatility event is brewing, regardless of what the headlines say tomorrow morning.
3. Market Concentration: The Danger of the “Magnificent 7”
Another critical factor justifying my position is the extreme concentration within the index. The S&P 500 has never been more dependent on a handful of mega-cap tech stocks. While the earnings growth of the “Magnificent 7” remains impressive, the “S&P 493” (the rest of the market) is struggling to keep pace.
This divergence is a massive red flag. If the market leaders show even a hint of exhaustion—whether due to market saturation, regulatory headwinds, or a simple rotation into deep value—volatility will skyrocket. I previously discussed how interest rate dynamics could impact the dollar and, consequently, these global tech giants in my article The Dollar Paradox of 2026: Why Falling Rates Will Skyrocket the DXY, where I explain why falling rates might counter-intuitively strengthen the Dollar and pressure risk assets.
4. The Math of Exhaustion: R^2 and Future Returns
If you need visual proof that the market is “borrowing” returns from the future, the scatter plots of valuation vs. returns provide the smoking gun. I analyze this data not as a curiosity, but as a probabilistic map. When we examine the relationship between the Forward P/E and subsequent 5-year annualized returns, the R^2 (coefficient of determination) is 30%.
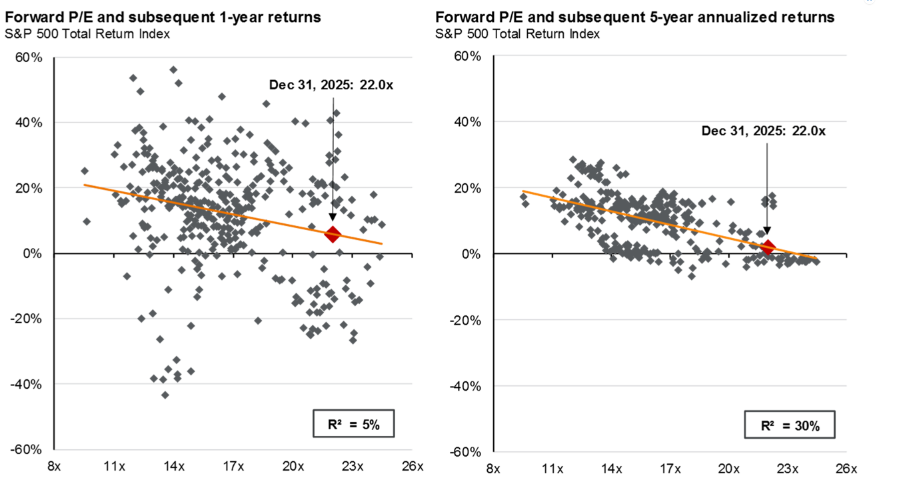
At a 22.0x Forward P/E, the regression line points toward annualized returns of nearly 0% to 2% over the next five years. In contrast, the current 10-year Treasury yield sits at 4.2%. Accepting a potential 1% equity return while taking on massive market risk is a fundamental failure of asset allocation. This statistical gravity is why I am positioned in the VIX; when the market realizes the “Growth” narrative cannot sustain these multiples, the exit will be narrow.
5. Macro Catalysts: From Tokyo to Greenland
While a technical trader doesn’t need news to enter a trade, the fundamental analyst in me cannot ignore the “black swans” circling the 2026 horizon. There are several triggers that could easily propel the VIX toward my 30-point target:
- The Japanese Debt Trap: Japan is at a point of no return with its monetary policy. A forced adjustment in Japanese Government Bond (JGB) yields could trigger a massive global liquidity shock. You can explore this specific risk further in my analysis of the Japanese Debt Trap.
- Geopolitical Friction: The recent judicial approval of aggressive trade tariffs, the bubbling sovereignty debates over Greenland, and the perennial tensions in the Taiwan Strait are all potential tinderboxes for the market.
- Tariff Implementation: If new protectionist policies are ratified by international courts, global supply chains will face a fresh inflationary shock, forcing the Fed and the ECB to abandon their “soft landing” narrative.
As reported by Reuters Financial Markets, the global interdependence of debt markets means that a spark in one region—like a sudden yen carry-trade unwind—can set the entire VIX complex on fire within hours.
6. Exit Strategy and Risk Management: The “30-Target”
I am not entering this Long VIX position with a ‘buy-and-hold’ mentality; volatility is a tactical weapon, not a long-term storage of value. Volatility is an asset class defined by its mean-reverting nature. The current VIX Term Structure shows that futures are in contango, meaning there is a “roll-yield” cost to holding this position. Therefore, my timing must be surgical.
My trade parameters are as follows:
- Price Target: I will exit the position when the VIX hits the 30 level. Historically, 30 is the threshold where retail panic becomes irrational and where the best “buy-the-dip” opportunities for equities emerge.
- Technical Confirmation: I am monitoring Heikin Ashi candles on the daily chart. The moment a clear red Heikin Ashi candle appears following a volatility spike, I will close the position, regardless of the spot price.
Personal Note: I am bracing for a “sideways-bearish” year. I don’t foresee a secular bear market, but rather a necessary correction to purge the excesses of 2025. This VIX trade is my bridge to navigate that correction with my capital intact and a profit in my pocket.
Frequently Asked Questions (FAQ)
Is the VIX a good long-term investment?
No. The VIX is a trading and hedging instrument. Due to the contango in futures markets, holding long VIX positions for extended periods results in significant losses due to “time decay” (theta). It should only be used for short-to-medium-term tactical plays.
What happens to the VIX when the S&P 500 rises?
Generally, the VIX has a negative correlation with the S&P 500. However, during “blow-off tops” or bubble phases, you can occasionally see both rise together as smart money starts buying “put protection” even as the market pushes higher.
Why use Heikin Ashi candles for the exit?
Heikin Ashi candles filter out market noise and provide a cleaner representation of the trend. Since volatility spikes are often violent and erratic, a Heikin Ashi reversal candle is a much more reliable signal that the local peak in panic has been reached.
Conclusion: Charts Over Narratives
In conclusion, maintaining a Long VIX stance in 2026 is not an emotional bet against global progress; it is a mathematical necessity born from historical precedent. When Forward P/E ratios hit the 22.0x threshold and the “fear gauge” is systematically ignored, the probability of a 10% to 15% correction shifts from a mere possibility to a statistical certainty. The catalysts—whether they involve the Japanese debt trap, the ratification of Greenland-related tariffs, or geopolitical tensions in Taiwan—are merely the external narratives that will eventually force the market to reconcile with its overstretched valuation.
I intend to manage this Long VIX trade with cold discipline, targeting an exit at the 30-point level. I will sell when “blood is in the streets” and the media consensus shifts from euphoria to predicting a systemic collapse. Until that target is hit, I remain firmly positioned on the right side of volatility, protecting my private portfolio while the broader market continues to sleep at the wheel.
Would you like me to perform a detailed technical breakdown of the VIX daily chart to identify the exact support levels where I am currently adding to the position?
Disclaimer: This article represents my personal opinion and private trading positions for 2026. It does not constitute financial advice. Investing in the VIX and its derivatives involves high risk of capital loss. Always consult a certified financial advisor before making investment decisions.