
As of February 2026, the WorkMarketsFinance public portfolio trading reached a total equity of €1,124.76, up from an initial capital of €1,000 in November 2025. Despite a realized profit of €65.54 over the last month, the strategy maintains a planned unrealized P/L (floating loss) of €332.24. This performance demonstrates that margin management and psychological resilience are the only true competitive edges in a market dominated by high-frequency AI agents.
1. The Monthly Thesis: Surviving the “Quantum Noise” of 2026
It is February 2026, and the market landscape has fundamentally shifted. Volatility is no longer just driven by human sentiment; it’s fueled by autonomous AI agents reacting to macro data in milliseconds. Major pairs like EUR/USD and commodity currencies (AUD, CAD) have become liquidity battlegrounds.
My thesis is straightforward: I don’t try to outguess the algorithms on precision entries. Instead, I focus on statistical exposure. The 2026 Forex market is cyclical; it’s designed to hunt stops. By operating without tight stop-losses and utilizing a grid-based approach with price averaging, I shift the power away from market makers and into my own capital management.
Critics might label my current drawdown as “risk.” I view it as inventory. Just as a retailer carries stock to sell later, a grid trader carries positions to harvest once the cycle mean-reverts.
2. Trading Performance: Hard Data
In the recent period, I closed 11 trades, all in the green. Below is the calculation for the total account return since inception:
Closed Trades Table (Jan/Feb)
| Instrument | Side | Profit (EUR) | Status |
| AUD/NZD | Short | +6.74 | Closed |
| EUR/USD | Short | +10.80 | Closed |
| USD/CHF | Long | +20.18 | Closed |
| GBP/USD | Short | +7.34 | Closed |
| USD/CAD | Long | +13.22 | Closed |
| AUD/USD | Short | +7.26 | Closed |
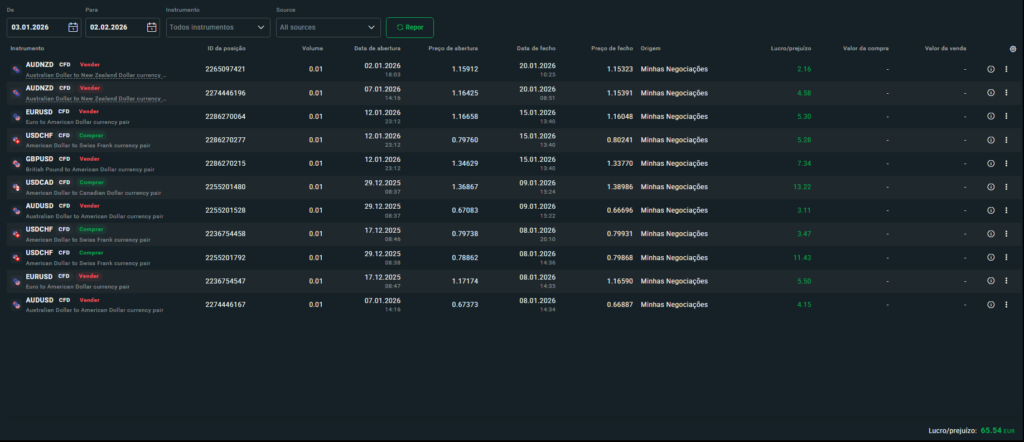
Transparency Note: My current unrealized P/L (Floating) is -€332.24. If I were to liquidate all positions now, the account would realize a loss. However, those familiar with myTrading Strategyunderstand that this drawdown is the “fuel” for future profits. My Margin Level stands at 148.90%—a level that requires vigilance but remains within the acceptable risk parameters for my recovery model.
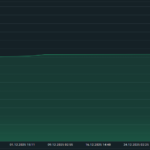
3. “Chart of the Month”: The Anatomy of Recovery
The equity curve shows a steady upward trajectory in realized profits. The secret isn’t the absence of losses, but statistical persistence.
- Key Takeaway: The €65.54 in realized profit during this period proves that even when the market moves against specific positions, asset rotation (AUD/NZD, USD/CHF, etc.) allows the account to continue generating cash flow.
- The 2026 Lesson: In an AI-driven world, patience is the only “edge” that cannot be easily coded into a scalping bot.
Conclusion: Want to See How This Ends?
Real trading isn’t what you see on social media. It’s not just green candles and luxury. It’s about stress management, margin calculations, and the courage to hold a thesis when the screen is red. I show it all: the profit in the pocket and the “inventory” on the chart.
If you’re ready to stop being the liquidity for big banks and start understanding how money actually moves in 2026, you need to be with us.
- Join our WhatsApp Community: Get real-time alerts on my portfolio adjustments.
- Subscribe to our YouTube Channel: Where I break down the technicals of these trades and explain how to survive 30% drawdowns with total confidence.
Related posts:
 The Dollar Paradox of 2026: Why Falling Rates Will Skyrocket the DXY (And How I’m Positioned)
 Why I Am Long VIX in 2026: Buying the Insurance Policy No One Wants
 Trading Portfolio January 2026: +11.8% Growth and My High-Conviction Bet on the Dollar Paradox
 The Great Crypto Reset: Why the Bitcoin Crash Was Inevitable and Where I’m Placing My Next Buy Orders