
The January 2026 CPI report revealed a headline annual inflation of 2.4%, down from December’s 2.7%, with Core CPI landing at 2.5%. Despite a persistent +0.2% in shelter, sharp declines in energy (-1.5%) and used vehicles indicate structural cooling. With Truflation already signaling 0.68%, deflation is a palpable risk. The breakdown of the 3.5% support on the US02Y paves the way for aggressive Fed cuts, making TLT my primary strategic conviction.
Yesterday, February 13, 2026, the markets received what I consider to be the official death certificate of the inflationary cycle that began in the post-pandemic era. I do not view the Bureau of Labor Statistics (BLS) data as mere cold numbers; I see them as the definitive confirmation of a thesis I have championed for months: the American economy is entering a phase of price stagnation that will soon transition into outright deflation.
I am writing this detailed article to explain why yesterday’s data is significantly more “dovish” than the headlines suggest and to break down the fundamental and technical reasons why I am aggressively loading my portfolio with TLT. If you don’t understand why the price of long-term bonds is the trade of the decade in this macro environment, this analysis is for you.
1. The Anatomy of the January CPI: What the Numbers Truly Reveal
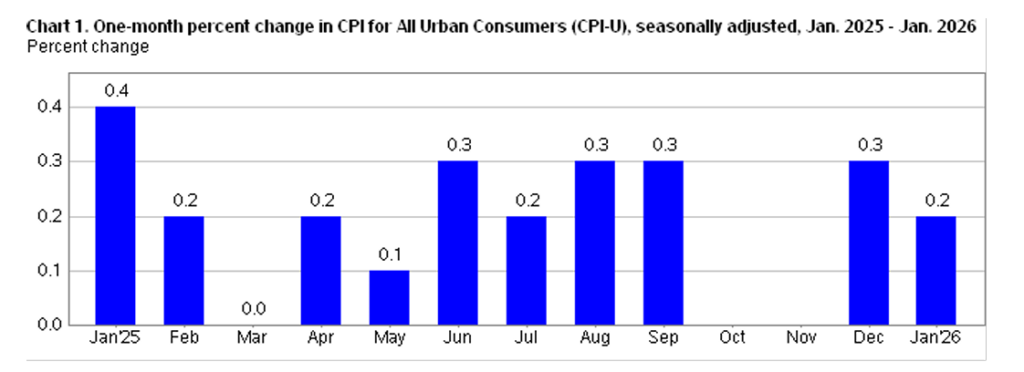
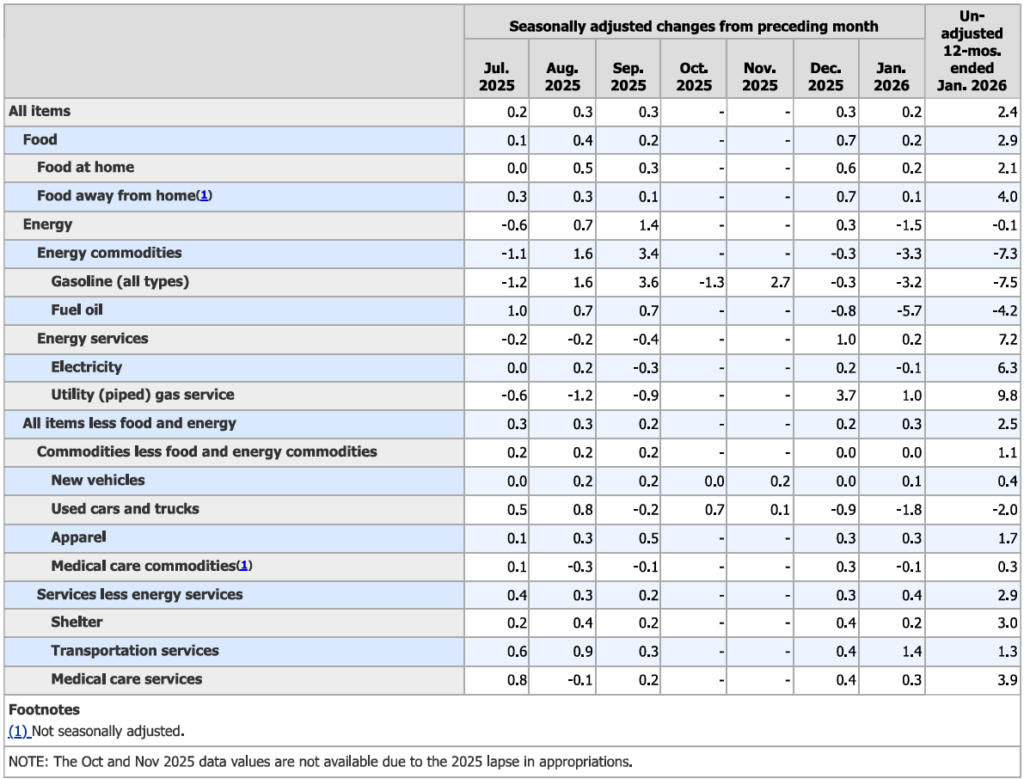
The CPI-U increased 0.2% in January on a seasonally adjusted basis. At first glance, this might seem like a lukewarm data point, but the devil—and the opportunity—is in the component details. Over the last 12 months, the all-items index rose 2.4%, the lowest print since mid-2025. When we strip out volatile food and energy to look at Core CPI, we see a 0.3% monthly increase, bringing the annual rate to 2.5%.
Analyzing the official documents I have before me, it is evident that the shelter index rose 0.2% in January and remains the single largest contributor to the monthly increase. It is fascinating to observe that without the disproportionate weight of shelter—which we all know is a severely lagging data point in the BLS methodology—inflation would already be comfortably below the Federal Reserve’s 2% target.
Another critical point: energy fell 1.5% over the month, driven by a 3.2% drop in gasoline prices. This more than offset the increases in airline fares and medical care. In my view, this energy slump isn’t just seasonal; it reflects weakening global demand and increasing energy efficiency.
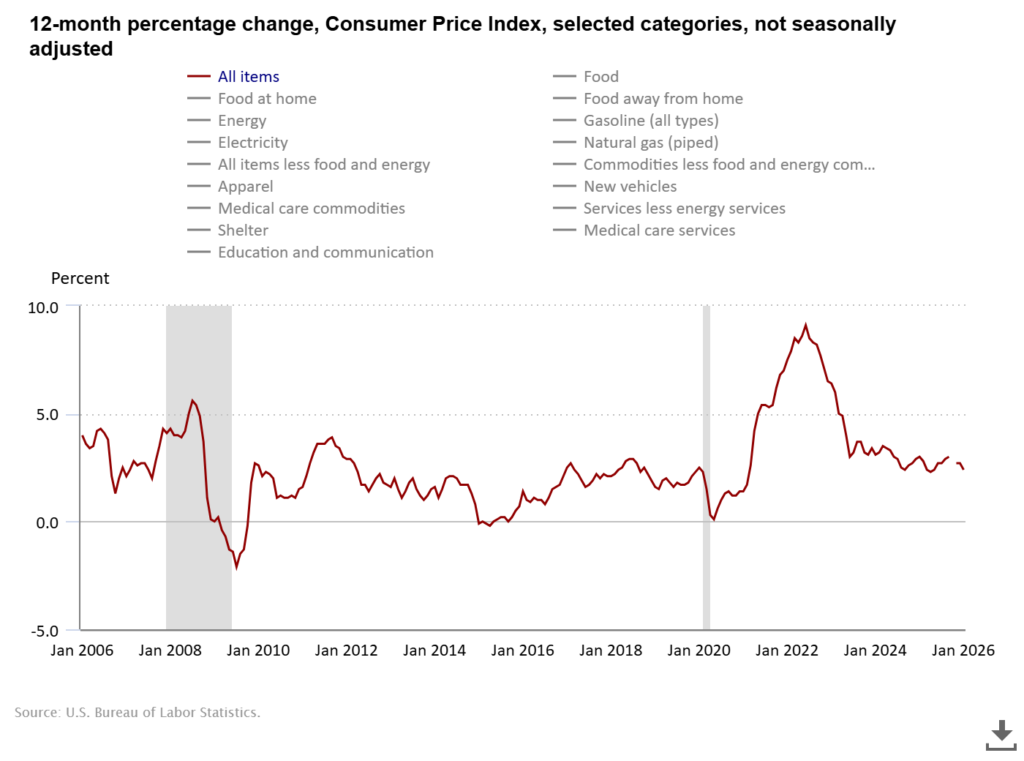
Looking at the two charts provided in the report, the trajectory is undeniable. The 12-month percentage change chart shows a structural “resting point.” We have moved from peaks of uncertainty to a line pointing directly south. The second chart, isolating the core, shows that services persistence is finally cracking. As an investor, I see this as the green light to anticipate a full pivot in monetary policy.
2. BLS vs. Truflation: Reality vs. Bureaucratic Lag
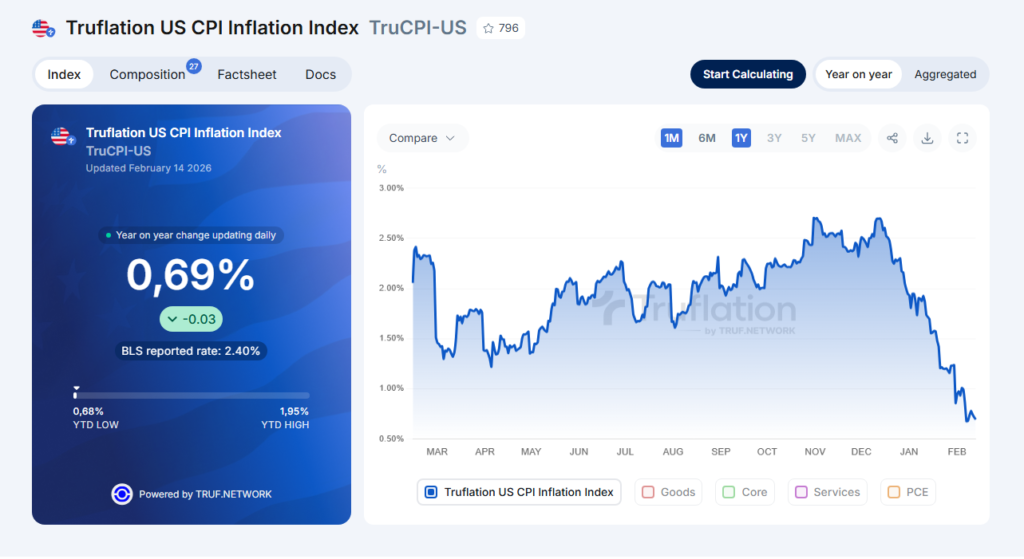
This section gets to the heart of my fundamentalist analysis. While the BLS tells us inflation is at 2.4%, Truflation—which utilizes over 30 million real-time data points—is already reporting an annual inflation rate of 0.68% (as of February 8, 2026).
Why is there such a massive discrepancy? The answer lies in methodology and lag.
The BLS relies heavily on Owner’s Equivalent Rent (OER), which is essentially a survey asking homeowners how much they think they could rent their houses for. It is a subjective figure that takes 6 to 12 months to reflect actual market transactions. Truflation, conversely, captures current rental listings from real estate portals today.
I firmly believe that what Truflation shows today is what the BLS will show six months from now. If real-time inflation is already below 1%, the Fed isn’t just “near” its goal; it has already overshot it and risks suffocating the economy by keeping rates restrictive for too long. This discrepancy is what gives me the conviction to bet against the consensus that “inflation is still a sticky problem.”
3. The Road to Deflation: AI, Debt, and Corporate Warnings
Many analysts still fear inflation, but when I look at the horizon, I see massive deflationary pressures. We are entering a period where the productivity gains from Artificial Intelligence will begin to drastically lower production and service costs. AI isn’t just “hype”; it is a deflationary force acting directly on corporate margins, allowing companies to lower prices or, at the very least, cease price hikes.
Furthermore, the American consumer is exhausted. After years of elevated interest rates, credit card debt has reached critical levels. When the consumer stops spending, companies lose their pricing power.
We saw clear signals of this in the recent earnings reports from giants like PepsiCo (PEP) and Chipotle (CMG). PepsiCo’s management spoke openly about “pricing investments” (a euphemism for price cuts) in their Frito-Lay division to protect sales volume. When companies of this caliber admit they can no longer pass price increases to the consumer, inflation is dead. CMG also noted a shift in consumer behavior, with traffic becoming increasingly value-sensitive.
This combination of AI-driven productivity and an overleveraged consumer is the perfect recipe for a deflationary shock that the market has not yet fully priced in.
4. The TLT Strategy: Why This is My Largest Position
My investment thesis is simple: if inflation is falling and the economy is cooling, interest rates must come down. And when rates fall, the price of long-term bonds goes up. This is why TLT (iShares 20+ Year Treasury Bond ETF) is the anchor of my portfolio in 2026.
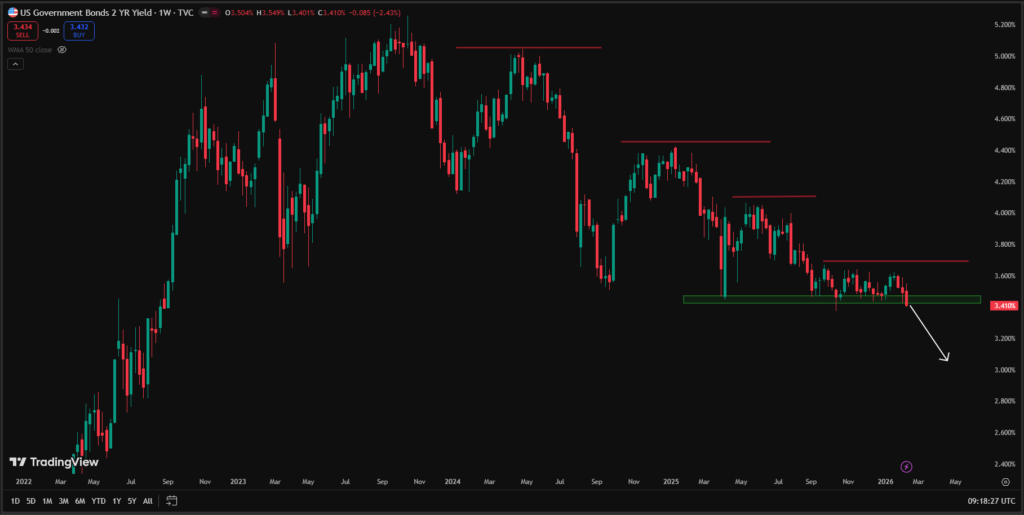
As I analyzed in my previous piece on the TLT opportunity for 2026, bond convexity is our greatest ally. Yesterday, we witnessed a crucial technical event: the yield on the 2-year Treasury (US02Y) broke the 3.5% psychological support level.
The US02Y Signal and the Fed
The US02Y is often regarded as the best indicator of what the Federal Reserve will do in the coming months. Breaking this support wasn’t an accident; it was the market’s response to the CPI data. The trend is clearly bearish (yields falling), giving the Fed immense room to cut rates. I see the US02Y heading toward 3% or lower, which will force the Fed to follow the path the market has already blazed.
Technical Analysis of TLT
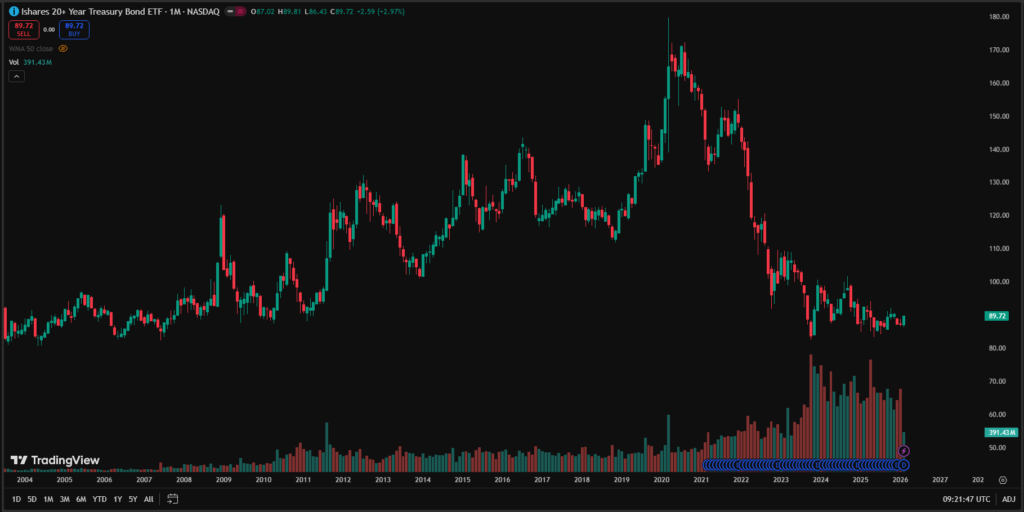
Looking at the TLT chart, I see a massive accumulation phase. Following the historic bear market in bonds, volume has begun to surge at these levels, indicating that smart money is moving in.
- This week, TLT rose nearly 2.5%, one of its best weekly performances in months.
- The price is forming a solid base, breaking above long-term moving averages.
- Increasing volume confirms institutional interest.
My strategy with TLT is twofold. First, I collect a monthly dividend currently yielding approximately 4% annually. It is excellent passive income while I wait for capital appreciation. Second, due to its long duration (approx. 15-16 years), for every 1% drop in long-term rates, TLT can appreciate by 15% to 20%. This is a risk-reward profile rarely seen in capital markets.
FAQ: Frequently Asked Questions on Inflation and TLT
What happens to TLT if inflation unexpectedly spikes?
If inflation rebounds, the Fed may hold rates higher for longer, which would pressure TLT prices downward. However, with Truflation at 0.68%, the risk of a sustained resurgence seems minimal at this stage.
Why is TLT better than holding Cash right now?
Cash (like T-Bills) offers a safe yield but no capital appreciation. TLT allows you to “lock in” high yields and profit from price increases when global rates inevitably fall.
How long do you plan to hold the TLT position?
I intend to hold until the Fed completes its cutting cycle and the yield curve fully normalizes. My technical target for TLT is in the $115-$120 range, representing significant upside from current levels.
Conclusion: The Great Pivot is Here
In summary, the January 2026 CPI data isn’t just “good”; it is the confirmation that the monetary tightening cycle is over. The resilience of shelter in the official index is merely methodological smoke hiding a much colder reality captured by Truflation.
I am positioned with high conviction: deflation is the next major macro theme. The breakdown of 3.5% on the US02Y was the starting gun. My focus remains entirely on accumulating TLT, capitalizing on the 4% yield while preparing for the massive valuation jump that will occur when the Fed is forced to act to prevent a deep recession.
History teaches us that bond markets lead the real economy. If yields are falling, growth is slowing. If growth slows, TLT shines. Do not be misled by lagging BLS headlines; look at what price action is telling you today.
Disclaimer: This analysis reflects my personal opinion and investment strategy. It does not constitute official financial advice. Investing in bond ETFs like TLT involves risks, including interest rate volatility. For official and detailed data, always consult theU.S. Bureau of Labor Statistics (BLS)reports.
Related posts:
 The Civil War at the Federal Reserve: Is Jerome Powell’s Resistance the Last Stand for Economic Stability?
 Trade War 2.0 Greenland: How to Shield Your Portfolio Against New NATO Tariffs and Arctic Volatility
 The Greenland Crisis: How Trump’s New Tariffs Could Wreck Your Tech Portfolio Today
 2026 AI IPOs: The Triumph of FOMO or the Next Dot-Com Burst?