
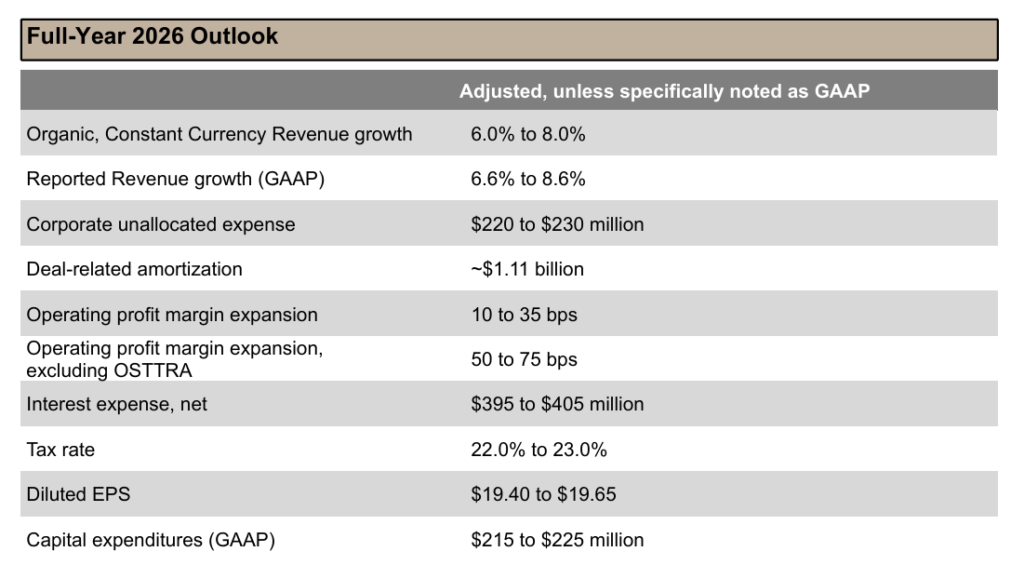
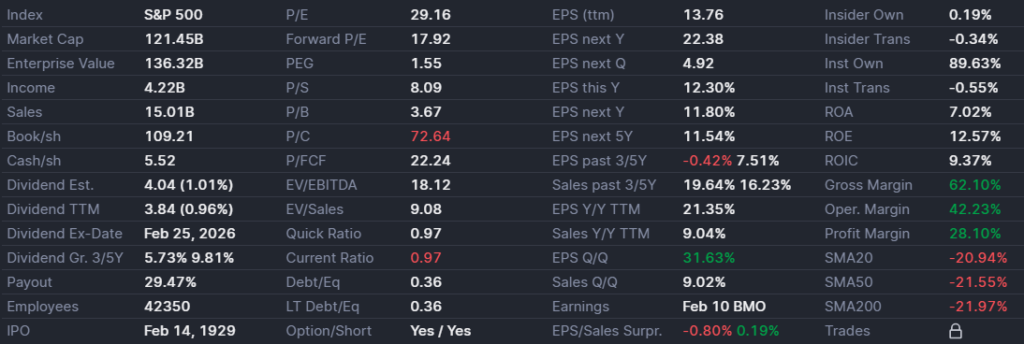
On February 10, 2026, S&P Global (SPGI) shares retraced approximately 10%, trading at a forward P/E of 20x, significantly below its five-year average of 30x. This correction followed a marginal EPS miss in Q4 2025 and conservative 2026 guidance. Despite market jitters, fundamentals remain elite: 47.3% operating margins, a $5 billion buyback program, and a structural recovery in ROIC. The investment thesis identifies AI as a secular tailwind for verified financial data providers.
Today, I made a move that many might view as catching a falling knife, but for me, it represents the culmination of months of strategic patience: I have officially initiated a position in S&P Global (SPGI). Following an abrupt 10% plunge in the last few hours, the market seems to have entered a state of panic over a slightly “tepid” 2026 outlook provided during this morning’s earnings call. For the short-term trader, this is a red flag; for me, it is the accumulation trigger I’ve been waiting for in an asset that rarely, if ever, goes on “clearance.”
I have spent years attempting to build a position in this company, but the valuation multiples were consistently prohibitive—often trading north of 35 times earnings. Now, fueled by an irrational fear that Generative AI will disintermediate the financial data sector, S&P Global has finally reached multiples that I consider fair, if not outright “sale” prices. We are discussing a legal oligopoly with an economic moat that is arguably the widest in the financial world.
1. Deconstructing S&P Global: Why Its Model is a “Cash Machine”
Many novice investors only associate S&P with the S&P 500 Index, but the corporation is much more than a ticker symbol. It is the “toll booth” of the global financial system. S&P Global operates through five core pillars: Ratings, Market Intelligence, Commodity Insights (Platts), S&P Dow Jones Indices, and Mobility.
The Ratings division is, without question, the crown jewel. In a world where governments and corporations must issue debt to survive or expand, S&P’s stamp of approval is mandatory. It isn’t a choice; it’s a regulatory and market requirement. If a corporation wishes to access capital markets efficiently, they must pay S&P to be rated. This is the quintessence of pricing power.
Meanwhile, the Market Intelligence segment provides the data and software infrastructure necessary for analysts and fund managers to function. Here, customer “stickiness” is absolute. Once an analyst’s workflow is integrated into the S&P ecosystem, the switching costs are astronomical. This is mission-critical vertical software at its finest.
2. The AI Narrative: Secular Threat or Massive Tailwind?
The primary driver behind today’s sell-off, beyond the headline earnings figures, is the narrative that Generative AI will replace traditional data providers. The market fears that if anyone can train a Large Language Model (LLM) to analyze balance sheets, S&P Global’s value proposition evaporates. I fundamentally disagree with this assessment.
In my analysis, AI will serve as a colossal tailwind for vertical software firms like SPGI. Why? Because AI is hungry for high-fidelity data. AI models that “hallucinate” are useless—and dangerous—in the world of high-stakes finance. A portfolio manager at BlackRock or an analyst at Goldman Sachs is not going to trust an open-source model that might fabricate a liquidity ratio. They require verified, audited, and normalized data.
S&P Global owns the intellectual property rights to one of the world’s largest repositories of financial truth. In today’s earnings report, management made it clear: AI integration is already boosting internal productivity and enabling the creation of new predictive analytics products that clients are eager to pay a premium for. AI doesn’t replace S&P; it makes S&P more efficient and its proprietary data more valuable.
Comparative Metrics: S&P Global vs. Historicals & Peers (2026 Data)
| Metric | S&P Global (Today) | 5-Year Historical Avg | Direct Peer (MCO) |
| Forward P/E Ratio | 20.1x | 31.4x | 24.8x |
| Operating Margin | 47.3% | 43.5% | 45.1% |
| Est. EPS Growth | 11% (5-yr CAGR) | 13% | 13.5% |
| Weekly RSI | 28.5 | 45.0 | 34.0 |
| Dividend Yield | 0.95% | 0.78% | 0.85% |
3. Demystifying ROIC and Operating Margins
A point that spooked some less experienced analysts was the ROIC (Return on Invested Capital), which currently hovers around 9%. For a company that historically boasts an ROIC above 20%, this looks like a quality decline. However, it is vital to look under the hood.
This temporary compression is a direct result of the massive strategic acquisitions (such as IHS Markit and subsequent smaller 2025 deals). When a company executes a mega-merger, the invested capital on the balance sheet balloons due to goodwill, while the earnings from the new entity take time to be fully integrated and optimized. My focus is on incremental ROIC, which remains exceptionally high.
The true indicator of economic power here is the adjusted operating margins, which have consistently stayed above 42% and reached 47.3% in recent quarters. Very few companies globally can maintain this level of profitability while scaling. It proves that for every extra dollar of revenue, a disproportionate amount flows directly to the bottom line. This is operating leverage in its purest form.
4. Share Buybacks: The Shareholder’s Silent Ally
S&P Global is a relentless “cannibal” of its own stock. In 2025 alone, the company returned $6.2 billion to shareholders, with $5 billion coming via share repurchases. In 2026, with the share price depressed, these buybacks become significantly more potent.
As an investor, I love it when an elite company repurchases shares at depreciated multiples. If the firm buys back its own stock at a 20x P/E, it is achieving a much higher “earnings yield” on that capital than it would at 30x. This accelerates Earnings Per Share (EPS) growth, which I project will average 11% annually over the next 5 years.
5. Technical Analysis: The Weekly RSI Trigger
While I am not a chart-only trader, ignoring technical setups would be negligent. Today, S&P Global’s Weekly RSI (Relative Strength Index) dipped below 30. Historically, for “blue-chip” compounders of this quality, a weekly RSI below 30 is a rare event and one of the most reliable buy signals in my toolkit.
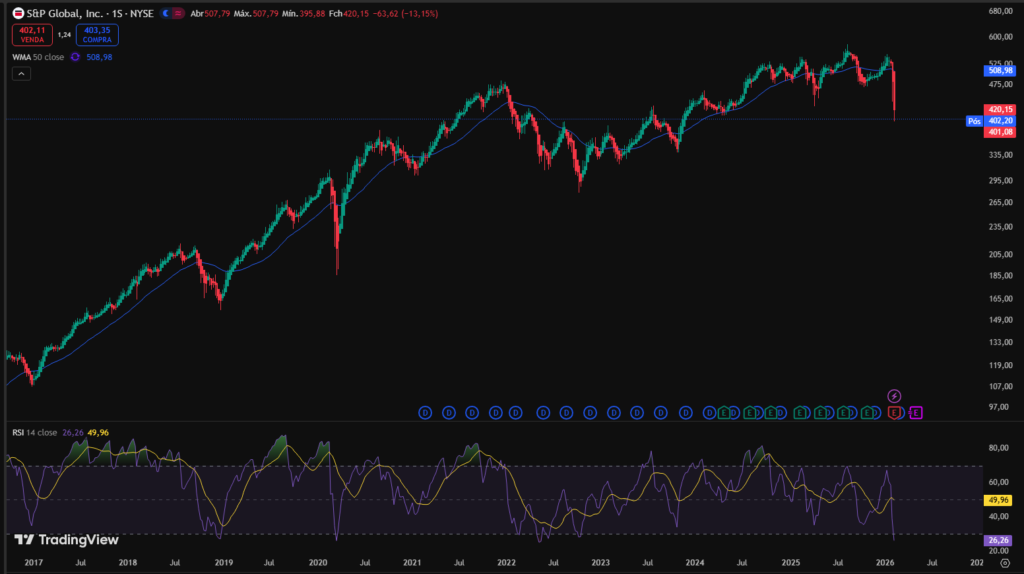
This indicates that the asset is technically “oversold.” The current panic, fueled by algorithms reacting to slightly lowered guidance, has created a disconnect between price and intrinsic value. While the stock could certainly continue to drift lower in the short term—especially if the “AI doomsday” narrative persists—my accumulation trigger is active. I am not “all-in” today; I am building the position “brick by brick,” using volatility to lower my cost basis.
6. Risks and the Corporate “Maturity Wall”
It’s not all sunshine. The primary risk for S&P Global isn’t AI, but rather global debt issuance volumes. If interest rates remain restrictive for too long (despite recent pauses by the Fed and ECB), corporations might postpone new bond issuances.
However, there is a mitigating factor: the maturity wall. Billions of dollars in corporate debt issued during the “zero-rate” era are set to expire in 2026 and 2027. These companies must refinance, regardless of the prevailing rates. And for every refinancing, S&P Global will be there to collect its rating fee.
Frequently Asked Questions (FAQ)
Will AI eventually destroy S&P Global’s business?
No. AI requires high-fidelity, verified data to function in professional financial contexts. S&P Global is the primary provider of this data, making them an essential partner—rather than a victim—of the technology.
Why has the ROIC dropped so significantly recently?
The dip to ~9% is temporary, caused by the accounting impact of large acquisitions like IHS Markit. Excluding the goodwill from these transactions, the core business profitability remains among the best in the world.
Is it better to buy now or wait for a further drop?
With a Weekly RSI below 30, the risk/reward is heavily skewed to the upside. However, since the market can remain irrational, a “Dollar Cost Averaging” (DCA) strategy is the most prudent approach.
What is the expected growth for the next 5 years?
The company is positioned to grow its EPS at a CAGR of roughly 11%, driven by margin expansion, AI-driven productivity, and aggressive share buybacks.
Conclusion: My Final Thesis and Position
My investment thesis for S&P Global is built on the resilience of a business model that is foundational to modern capitalism. Unlike consumer-facing tech, as I discussed in my Netflix 2026 Investment Thesis, S&P does not depend on fickle consumer trends, but on the perennial need for credit and data.
Today’s 10% drop is, in my view, market noise that ignores the company’s ability to adapt and dominate the AI era. With 42%+ margins, a 53-year track record of dividend increases, and a multiple that has finally returned to reality, SPGI is an “anchor” for any long-term portfolio.
I have initiated my position with high conviction, fully aware that the near-term path may be volatile, but confident that intrinsic value will eventually triumph over temporary fear. For further details on their official filings, I highly recommend visiting the S&P Global Investor Relations page.
Will we see a 30x P/E again? I believe so—the moment the market realizes that AI is the greatest ally S&P Global ever had.
Disclaimer: This article represents my personal opinion and does not constitute financial advice. Investing in equities involves risk. Conduct your own due diligence before making any investment decisions.
Related posts:
 Constellation Software (CSU): Why I Am Aggressively Doubling Down on This Generational Opportunity Amidst Extreme Market Fear
 Ferrari Stock: Why I’m Buying Ultra-Luxury at a 40% Discount?
 Skin in the Game: Portfolio January 2026 – Why I Doubled Down on Constellation Software (CSU)
 TLT Opportunity 2026: Why I’m Betting Big on US Treasuries and the Dollar