
Compound interest is the primary engine of modern wealth creation, facilitating exponential capital growth through the systematic reinvestment of earnings. As inflation persistently devalues fiat currencies, utilizing an interest calculator to project long-term returns in the S&P 500 is a fundamental necessity for every investor.
Historically, the index provides average annual returns of approximately 10%, outperforming economic crises and geopolitical instability. This makes the S&P 500 a premier vehicle for generational wealth preservation. Use the simulator below to visualize how consistent contributions can transform your financial future.
Investment Growth Simulator
Projected Future Balance
Investment Breakdown
Annual Breakdown Data
| Year | Total Invested | Interest Earned | End Balance |
|---|
I have consistently argued over the last few years that the greatest force in the financial universe isn’t the ability to “time” the next Silicon Valley breakout or the skill to execute high-frequency trades. The true power—the kind that transforms ordinary savers into financially sovereign individuals—is the cumulative effect of time on capital. It is now 2026, and after navigating the extreme economic volatility of the mid-2020s, one truth remains more evident than ever: those who understand compound interest earn it; those who don’t, pay it.
In this deep dive, I want to take you on a journey through the “math of wealth.” I will explain why stagnant cash is a dying asset, how indices like the SPY (S&P 500) act as a natural filter for quality, and how you can use our interest calculator to map out your own exit from the “rat race.” If you are looking for a technical and fundamental analysis that cuts through the noise of social media “fin-fluencers,” you are in the right place.
1. The Anatomy of Wealth: Why the Math is on Your Side
To grasp the magnitude of what we are discussing, we must look at the technical foundation. Compound interest is, essentially, the application of interest not just to the initial principal, but to the accumulated interest of prior periods as well. Unlike simple interest, which grows linearly, compounding grows exponentially.
The mathematical governing formula for this phenomenon is:
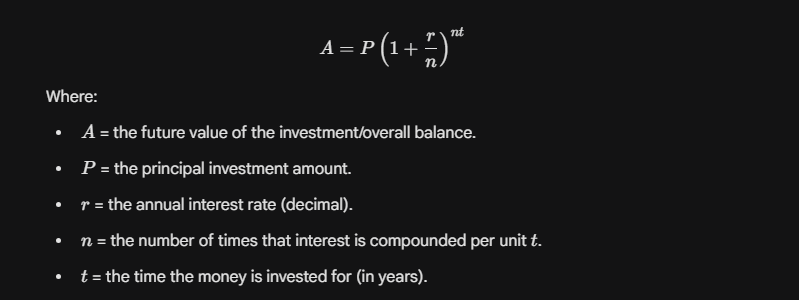
What I want you to focus on here is the variable t (time). It is the exponent of the equation. This means that, in the long run, time is significantly more impactful than the interest rate or the initial amount. I often say that time is the patient investor’s greatest ally and the hurried speculator’s worst enemy. When you invest in the S&P 500, you are putting this formula to work for you 24/7, across decades.
2. The Invisible Predator: Purchasing Power Loss and the Devaluation of Fiat
One of the most catastrophic mistakes I see investors make is confusing “safety” with “lack of volatility.” Many believe that keeping money in high-yield savings accounts or, worse, under a mattress, is a “safe” strategy. I fundamentally disagree. In 2026, data from the Federal Reserve (Fed) and the Bureau of Labor Statistics (BLS) shows that even if inflation stabilizes, the cumulative loss of purchasing power is a one-way street.
Fiat currency (the Dollar, the Euro) is designed to lose value. Central banks target a 2% annual inflation rate, meaning your money is mathematically programmed to be worth less every year. If your capital is not deployed into assets that produce real value, you are becoming poorer in silence. Investing isn’t a luxury; it’s a survival mechanism to protect the fruit of your labor against monetary dilution. By using an interest calculator, you can see how much you need to earn just to break even against the rising cost of living.
3. The S&P 500 as a Quality Filter: The Secret of Natural Rebalancing
A frequent question I receive is: “What if the companies in the index go bankrupt?”. The answer is: some will, and that is exactly why the index is so powerful. The S&P 500 is not a static list; it is a living, breathing algorithm of financial natural selection.
ETFs that track the S&P 500, such as SPY or VOO, follow an index that is periodically rebalanced. This ensures two things:
- Obsolete companies are purged: If a company stops innovating, loses market share, and its valuation drops, it is kicked out of the index.
- Emerging leaders are added: When a new tech giant or industrial powerhouse rises, it is added to the index, replacing the losers.
When you invest in an index fund, you are delegating your portfolio management to a system that only retains the crème de la crème of the global economy. You don’t need to guess which company will be the next Nvidia; the index does that work for you. It is “survival of the fittest” applied to finance, and it is why the index consistently trends upward over decades.
4. Historical Analysis: Decades of Resilience (1930 – 2026)
For the skeptics who fear political unrest, wars, or pandemics, historical data is the best antidote. I have prepared the following table based on historical performance reports to show that the market has a phenomenal capacity for recovery, regardless of the macroeconomic backdrop.
S&P 500 Performance by Decade
| Decade | Accumulated Return | Annualized Return | Historical Context |
| 1930-39 | -9% | -1% | The Great Depression |
| 1940-49 | +126% | +9% | World War II |
| 1950-59 | +492% | +19% | Post-War Economic Boom |
| 1960-69 | +111% | +8% | Cold War / Vietnam |
| 1970-79 | +78% | +6% | Oil Shocks / Stagflation |
| 1980-89 | +396% | +17% | Reaganomics / Liberalization |
| 1990-99 | +433% | +18% | The Dot-com Boom |
| 2000-09 | -9% | -1% | 9/11 / 2008 Financial Crisis |
| 2010-19 | +256% | +14% | Quantitative Easing Era |
| 2020-25 YTD | +127% | +15% | COVID-19 / AI Revolution |
Data Source: S&P Global / WorkMarkets Finance Analysis
Look closely at these numbers. Even in the “lost decades” (the 1930s and 2000s), the market recovered aggressively in the years that followed. I don’t view a crisis as a disaster; I view it as an opportunity to buy high-quality assets at a discount. Those who maintained a disciplined compound interest strategy through these periods saw their net worth multiply exponentially.
5. How to Use the Interest Calculator to Map Your Future
Our investment growth simulator (found at the top of this page) was designed to provide you with mathematical clarity. Most people overestimate what they can do in one year but drastically underestimate what they can achieve in twenty.
By inputting your data—for instance, a $100 initial investment and a $100 monthly contribution, with a 10% return (the S&P 500 historical average)—you will see that after 20 years, you will have accumulated approximately $76,670.
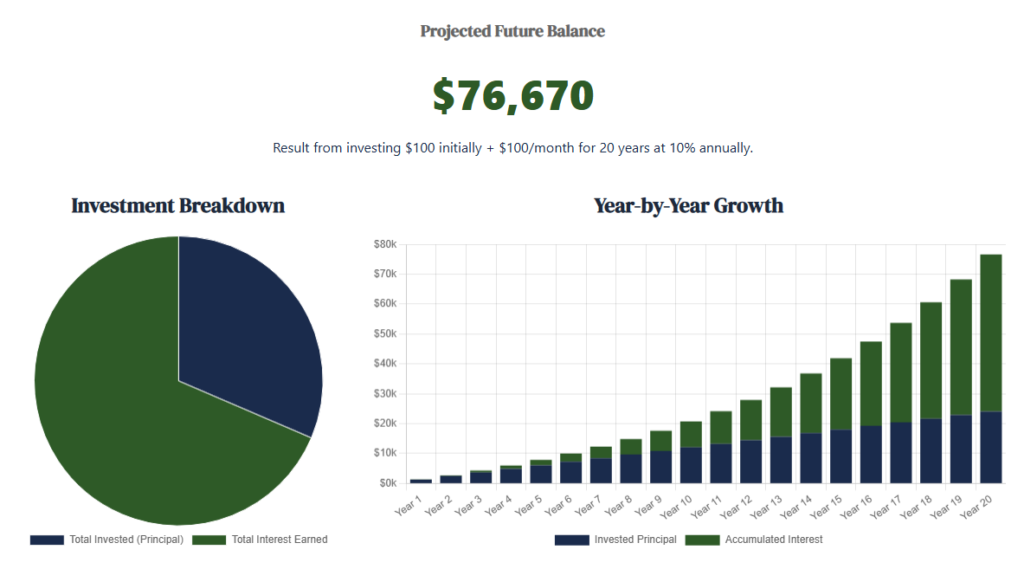
Fundamental Breakdown of the interest calculator Simulation
- Total Contributions: You only contributed $24,100 out of pocket.
- Interest Earned: Over $52,000 was generated purely by market growth.
- The Tipping Point: Notice how the bar chart becomes nearly vertical in the final 5 years. This is where compound interest does the heavy lifting.
My personal recommendation: Do not wait for the “perfect time” to start. The market isn’t about timing; it’s about time in the market. Every month you delay starting your investment plan is a month you are cutting off the most lucrative years of your future exponential curve.
6. Managing Risk and Volatility: The Long-Term Mindset
We must be realistic: investing is not a straight line up. There will be years where your portfolio is down 10%, 20%, or even 30%. However, this is where the professional investor separates themselves from the amateur. Volatility is the “entry fee” you pay for returns that beat inflation.
I define risk not as price fluctuation, but as the possibility of permanent loss of capital. If you invest in a single “hype” stock, the risk of total loss is real. If you invest in a diversified ETF like the SPY, that risk is virtually non-existent unless you believe in the total collapse of global civilization—in which case, no asset would be safe.
Protect your capital by maintaining discipline. In 2026, with easy access to low-cost brokerages, the only barrier between you and financial freedom is your ability to stick to the plan when the market panics.
FAQ – Frequently Asked Questions
Will the S&P 500 continue to rise in the future?
Historically, the index reflects human productivity and technological innovation. As long as corporations strive for profit and efficiency, the long-term trend remains upward, bolstered by the automatic rebalancing of the index.
Is there a “best” time to start using an interest calculator?
The best time was yesterday. The second best time is today. The most critical factor for compound interest is the duration of exposure, not the current entry price of the market.
Is it safe to put all my money in an S&P 500 ETF?
While total diversification is impossible, the S&P 500 provides exposure to 500 of the world’s most successful companies. For most retail investors, it represents one of the most robust and historically proven ways to grow wealth.
Conclusion: Your Financial Future is a Mathematical Choice
Throughout this analysis, I’ve shown you that wealth building isn’t a mystery reserved for the elites of Wall Street. It is a matter of discipline, patience, and understanding basic mathematics. We have seen how inflation destroys the passive saver and how the S&P 500, through its natural selection mechanism, protects the active investor.
I firmly believe that financial freedom is an accessible right for anyone willing to trade immediate consumption for future security. Use the interest calculator on this page, set your goals, and start. The market has survived everything—World Wars, Depressions, and social upheavals—and it has always emerged stronger. Your capital belongs on the side of the winners.
If you want to learn more about selecting the best platforms to implement this strategy, read my guide on Choosing a Brokerage in 2026. For official data on historical yields, you can visit the Standard & Poor’s Data Portal.
Curious to see these mathematical principles in real-world action? Discover the incredible true story of how a humble janitor built a multimillion-dollar fortune by reading my full analysis of Ronald Read’s legendary stock-picking strategy.
Remember: Time will pass anyway. The only question is whether it will be working for you or against you.
Disclaimer
This article is for informational and educational purposes only. I am not your financial advisor. Investing in the capital markets involves risk, and past performance is not a guarantee of future results. Always analyze your personal financial situation before making any investment decisions.