
To master how to pick stocks to buy in 2026, I prioritize high-quality assets with a ROIC exceeding 20%, revenue growth above 10%, and an annualized EPS of 15%. My methodology combines rigorous fundamental analysis with strategic technical entries using RSI below 30 on Heikin Ashi charts. In February 2026, with the Fed’s interest rates stabilized at 3.25% and the S&P 500 showing selective volatility, I focus on “Economic Moats” in companies like Microsoft, Palantir, and Ferrari.
I do not view the financial market as a casino or a game of luck. For me, investing is, above all, a meticulous process of elimination. Every day, we are bombarded by “hot tips” and social media hype, but the truth is that most investors lose money because they buy stories, not businesses. If you truly want to master how to pick stocks to buy, you need to stop being a lottery ticket collector and start becoming an owner of elite enterprises. In this deep dive, I am opening the doors to my personal strategy—the same one I use to filter the few winners in a sea of mediocrity, specifically tailored for the 2026 macroeconomic landscape.
1. The 10-Year Vision: The Filter of Essentiality
Before opening any Excel spreadsheet or analyzing a candlestick chart, I ask the most important question of all: “Will this company still be essential a decade from now?”. If the answer is not an absolute and immediate “yes,” I don’t even waste time looking at the financial ratios. In 2026, we live in an economy shaped by mature Generative AI and the advanced energy transition, where obsolescence occurs faster than ever.
I look for business models that don’t just survive but shape the future. Consider Microsoft ($MSFT). In 2036, will businesses still need cloud infrastructure and AI-integrated productivity tools? Almost certainly. In contrast, a company riding a fleeting consumer trend might vanish in three years. My long-term vision acts as a shield against short-term volatility. If I cannot see the company at the top of its sector in ten years, it is immediately eliminated from my checklist.
2. The Economic Moat and the Dictatorship of ROIC
The concept of the “Economic Moat,” popularized by Warren Buffett, is more relevant today than it has ever been. However, I don’t rely solely on qualitative aspects. I demand numerical proof that the company possesses an unbeatable competitive advantage. My favorite indicator for this is ROIC (Return on Invested Capital).
The Golden Rule: If the ROIC is consistently above 20%, the company is an efficiency machine.
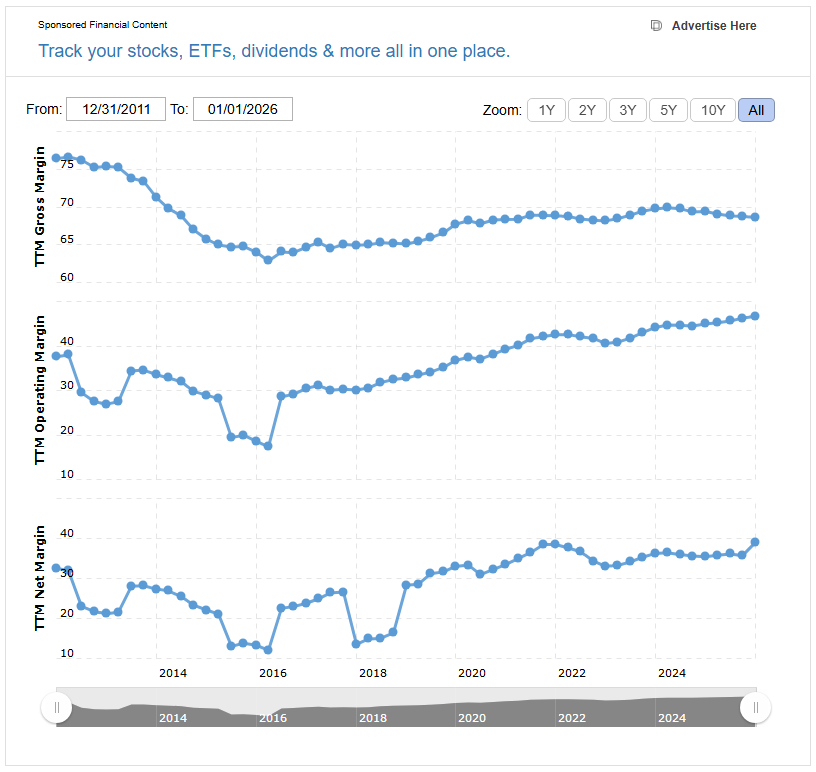
A high ROIC indicates that management can effectively reinvest profits back into the business to generate massive returns. This is what separates a “good” company from an “extraordinary” one. When I analyze Ferrari ($RACE), for instance, I see operating margins nearing 30% in 2026, sustained by a brand power that allows for extreme pricing power. That is a real moat. Without elite ROIC, growth is merely an illusion that consumes capital instead of creating it.
3. The Growth Engine: The Dance Between Revenue and EPS
Many investors make the mistake of looking only at top-line growth (Revenue). I am far more demanding. I want to see a consistent and parallel growth story. For a stock to enter my radar, it must demonstrate:
- Revenue Growth: Greater than 10% annually.
- EPS (Earnings Per Share) Growth: Greater than 15% annually.
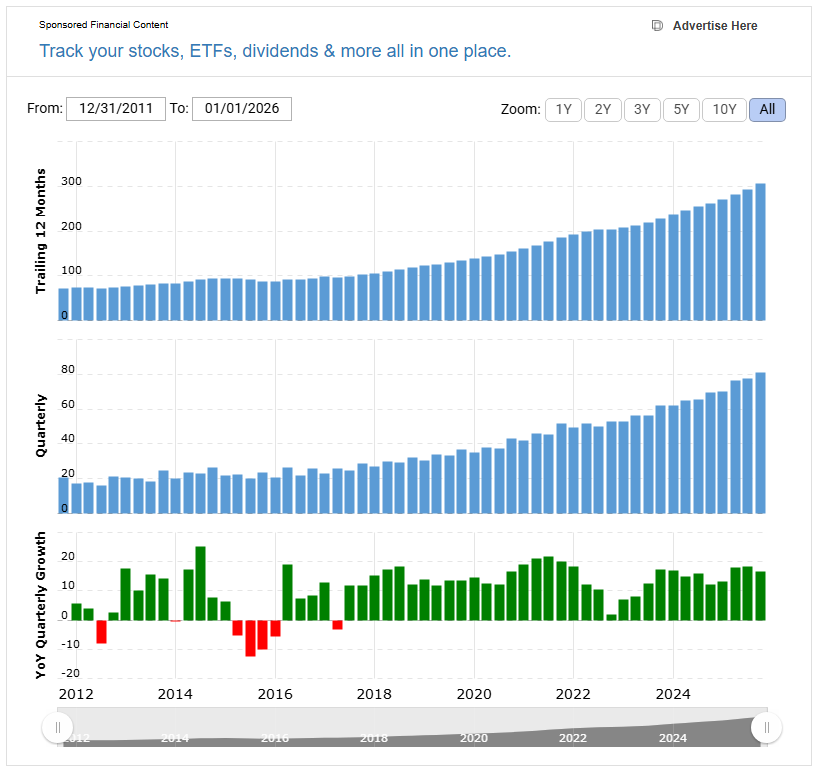
This 5-percentage-point delta is vital. It shows me operating leverage. It means the company is becoming more efficient as it scales. Palantir ($PLTR) is a fascinating case study in 2026. With revenues surging as their AI software becomes the “operating system” for both government and modern enterprise, the company has proven that its profits can grow significantly faster than its costs. If sales go up but earnings per share stagnate, I walk away. That is a red flag for poor management or a predatory competitive environment.
Data Table: Elite Fundamentals (2026 Projections)
| Asset | Est. ROIC | Revenue Growth (YoY) | Operating Margin | FWD P/E Ratio |
| Microsoft ($MSFT) | 28% | 14% | 42% | 32x |
| Palantir ($PLTR) | 18% | 40% | 25% | 65x |
| Ferrari ($RACE) | 24% | 8% | 30% | 45x |
| S&P 500 Average | 11% | 5% | 15% | 21x |
4. Margins and Capital Management: The Power of Buybacks
A company can have a fantastic product, but if management is too “friendly” with shareholder dilution, my investment will be eroded. I look for what I call “Stock Cannibals.” These are companies that use their Free Cash Flow to aggressively buy back their own shares.
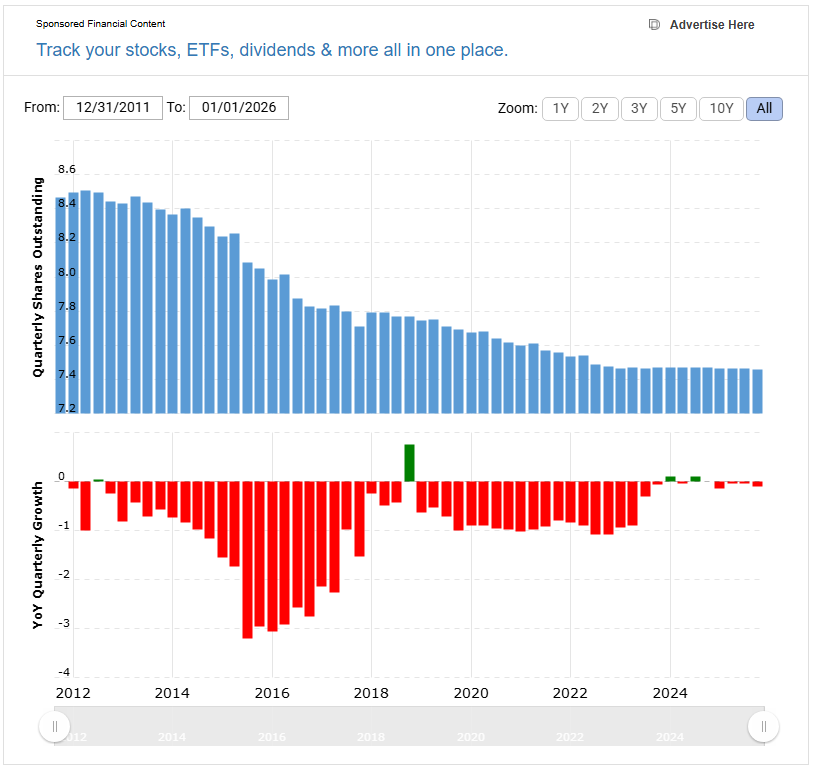
If the “Shares Outstanding” chart consistently trends downward over the years, my slice of the pie increases without me having to spend an extra cent. Furthermore, I analyze gross margins. High margins are a company’s “oxygen” during inflationary periods. In February 2026, with the Federal Reserve maintaining a cautious stance on quantitative tightening, companies with low debt and high margins are the ones navigating the “soft landing” most effectively.
5. Valuation: P/E Matters, but Intrinsic Value is King
Don’t fall into the trap of thinking a company is “cheap” just because its P/E (Price-to-Earnings) ratio has dropped. The market always provides opportunities when the narrative shifts and fear-induced corrections occur. I use analyst perspectives from institutions like Goldman Sachs or Morgan Stanley merely as additional data points, but my final decision is always based on intrinsic value.
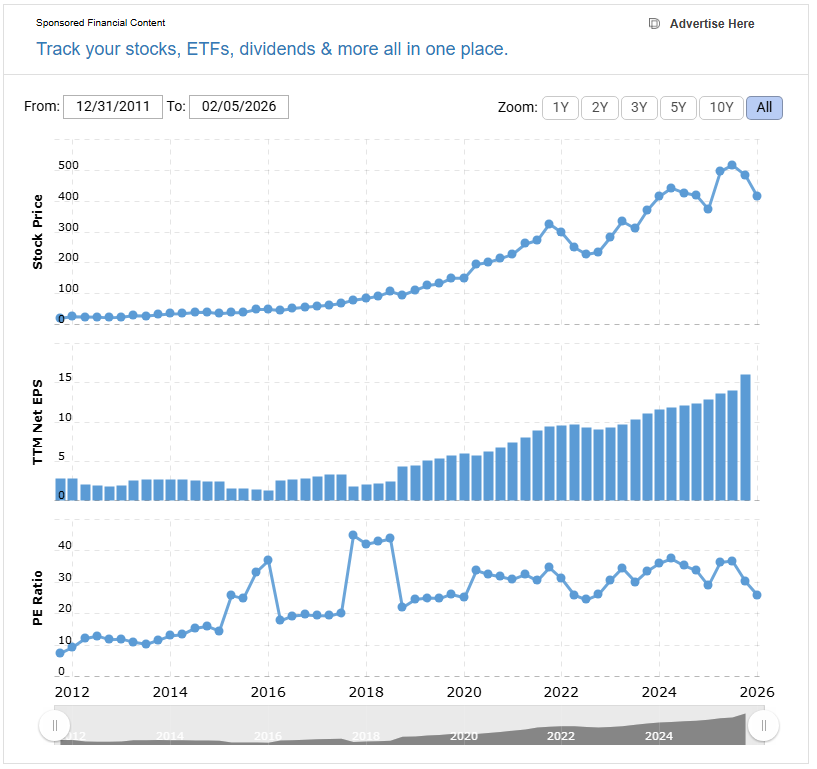
I would rather pay a premium for an extraordinary company (like Ferrari at 45x earnings) than buy a mediocre company “cheap” at 8x earnings. However, the price you pay determines your return. In 2026, the “higher for longer” interest rate environment has moderated the absurd valuations of 2021, making Discounted Cash Flow (DCF) analysis the most powerful tool in my arsenal.
6. Technical Entry: Opportunity in Panic
This is where I separate my fundamental analysis (the “what” to buy) from my technical analysis (the “when” to buy). I rarely buy at all-time highs. My patience is my greatest virtue. I wait for market “sales.”
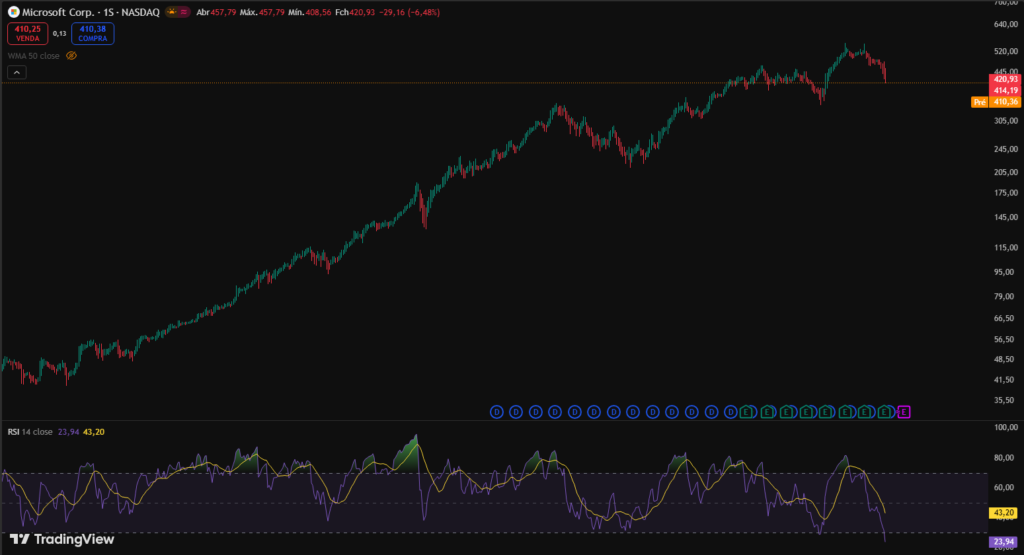
My favorite technical setup involves Heikin Ashi candles and the RSI (Relative Strength Index). I look for moments when the RSI drops below 30 on the daily or weekly chart. This is the point where the panic of others becomes my opportunity for position sizing. As we have seen in recent market data, even giants like Microsoft ($MSFT) occasionally hit oversold levels during sector rotations. For the average investor, this is scary. For me, it is an invitation to enter an elite company at a discount.
7. Capital Management: The Secret to Longevity
The biggest beginner mistake I see is the “all-in” move. I never do this. My approach is gradual accumulation. I leverage the inherent volatility of the market to lower my average cost—a strategy known as Strategic Dollar Cost Averaging (DCA).
If the company’s fundamentals (ROIC, Moat, Growth) remain intact, a 10% or 20% drop in stock price is merely market noise that allows me to buy cheaper. I divide my entry into 3 or 4 tranches, increasing exposure as the thesis is confirmed or as the price hits major historical support levels. This discipline protects my capital and ensures I stay in the game long enough for compound interest to perform its magic.
When it comes to the practical execution of my strategy, my conviction in Microsoft ($MSFT) is not merely theoretical; it is a deep-seated belief anchored in their unwavering balance sheet and dominance in the AI infrastructure space. I recently detailed my full technical and fundamental rationale in my dedicated analysis, Microsoft: Starting a Position, where I explain why I believe current price levels offer a risk-reward asymmetry rarely seen this decade. It is not about following the tech herd, but rather understanding how the vertical integration of Azure with generative AI in 2026 has cemented a cash flow so resilient that ignoring this window of opportunity would be a strategic error in long-term capital management.
FAQ: Frequently Asked Questions on How to Pick Stocks
Is the P/E Ratio the most important indicator?
Not in isolation. A low P/E can be a “value trap” if the company is in terminal decline. It must always be analyzed alongside EPS growth and sector quality.
When should I sell a stock in my portfolio?
I only sell in two situations: if my fundamental thesis changes (the moat has vanished) or if the asset becomes absurdly overvalued relative to its historical growth, distorting my portfolio’s risk allocation.
Conclusion: Discipline Trumps Intelligence
Successful investing in 2026 requires a rare combination of cold analysis and emotional patience. By following this checklist—10-Year Vision + ROIC > 20% + Double-Digit Growth + Fair Price + Technical Patience—you will be ahead of 99% of market participants.
My position is clear: I am not looking for the next “lucky coin.” I am looking for technological and luxury monopolies and oligopolies that generate cash regardless of who is in the White House or at the helm of the Fed. The Stock Market is a mechanism for transferring money from the impatient to the patient. The question I leave you with is: are you buying real businesses, or are you just betting on the color of tomorrow’s candles?
Would you like me to perform a detailed deep-dive into the AI Infrastructure vs. Luxury sector for your next capital allocation?
Federal Reserve official reports and 2026 economic outlook
This external link provides the official schedule and reports from the Fed, essential for verifying the interest rate context mentioned in this analysis.
Related posts:
 Silver in 2026: Is This Price Explosion Just the Beginning or a Short-Term Trap?
 Bitcoin DCA Strategy with Heikin Ashi: My Blueprint to Defeat Fiat Currency Devaluation
 Is the Stop Loss Obsolete? Why in 2026 I Use Hedging as My Antifragile Shield
 The Death of the Stop Loss? My Forex Trading Strategy Based on Cyclicality and Proportional Volume