This article outlines a disruptive 2026 Forex trading strategy that replaces traditional stop losses with institutional-grade hedging and proportional position sizing. Grounded in the philosophy that markets are inherently random yet historically cyclical, the methodology synchronizes weekly directional bias with 4-hour execution. By leveraging EUR/USD mean reversion and RSI filters, I demonstrate how to manage “floating drawdowns” mathematically rather than emotionally, providing a blueprint for long-term currency appreciation and capital preservation.
It is January 2026, and after nearly a decade of navigating the chaotic ebbs and flows of the global currency markets, I have reached a conclusion that many Wall Street veterans would deem pure heresy: the market, in its immediate state, is entirely random. If you have followed my work, you know I am not a fan of “magic bullet” indicators or retail setups that claim to predict price action with surgical precision. My evolution as a trader has led me to develop a 2026 Forex trading strategy built on much sturdier, albeit more controversial, pillars: historical cyclicality and mathematical volume management.
In this comprehensive guide, I am peeling back the curtain on my proprietary methodology. We will explore why proportional volume is your ultimate defensive shield, how a single weekly candle color can dictate your bottom line, and—most importantly—why I have decided that the stop loss is often the greatest enemy of consistent institutional-grade profitability. If you want to understand how I navigate the EUR/USD in today’s economic climate, prepare for a deep, unfiltered analysis of price mechanics.
1. The Philosophy of Randomness: Why I Don’t Forecast
The fundamental flaw in most retail trading systems is the illusion of control. Traders spend thousands on “advanced” courses teaching head-and-shoulders patterns or complex Elliott Wave counts, operating under the delusion that the market is obligated to respect these arbitrary lines on a screen. In my worldview, I embrace absolute randomness.
I do not know, nor do I care to guess, where the price will be in the next hour. At any given moment, a major institutional player or a “black swan” event can inject massive liquidity, invalidating every technical analysis trendline in existence. However, while short-term volatility is random, the long-term behavior of fiat currencies is profoundly cyclical.
If we analyze the EUR/USD through a multi-decade lens, we see a fascinating pattern: price has gravitated around the same equilibrium zones for over 45 years. The Euro traded at similar relative values in 1987, 1993, 2015, and here we are again in 2026. Unlike equities, which have an inherent upward bias due to inflation and corporate growth, currencies represent the relative strength between two economies. They oscillate in massive “trading ranges” that can span decades. It is within this cyclicality that I find my statistical edge.
Historical Data & Macro Analysis: To fully grasp the cyclicality I discuss, analyzing historical real exchange rate data is essential. I highly recommend consulting the FRED (Federal Reserve Economic Data) database, where you can verify decades of EUR/USD price action and validate the long-term range-bound nature of this pair.
View the official EUR/USD historical data on FRED here
2. Proportional Volume: The Science of “Micro-Scaling”
If the market is random, how do I survive? The answer lies in proportional volume. Most traders are liquidated by their own greed; they attempt to use excessive leverage to turn $1,000 into $10,000 in a month. In my strategy, I utilize volumes that most would consider “insignificant.”
I view my capital as a reservoir to be distributed across hundreds of potential entries. Even if my account balance allows for a standard lot, I prefer to open 0.01 micro-lots, spreading risk across a wide price territory. My goal is a controlled floating drawdown. By entering with micro-volumes, I am indifferent to a 200 or 300-pip move against my initial position. I have enough “fuel” to withstand the pressure and manage the trade until the market’s cyclical nature pulls the price back toward the mean.
Comparative Data: Retail Trading vs. Proportional Strategy
| Feature | Traditional Retail Trading | My 2026 Strategy |
| Risk Management | Fixed Stop Loss (20-50 pips) | No Stop Loss / Strategic Hedging |
| Position Sizing | High Leverage (0.10 to 1.00 lots) | Proportional Micro-lots (0.01) |
| Primary Timeframe | 5m, 15m, or 1h (Scalping) | Weekly (Trend) & 4H (Execution) |
| Analysis Focus | Chart Patterns & Lagging Indicators | Candle Color, RSI, & Cyclicality |
| Psychology | High Stress (Stop-out fear) | Calm Management of Price Cycles |
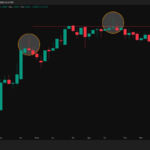
3. The “Traffic Light” Forex Trading Strategy: Decoding Weekly Bias with Heikin Ashi Candles
Simplicity is the ultimate sophistication in trading. To define the trend, I don’t use complex moving average crossovers or Ichimoku clouds. I look at the weekly candle color.
- Green Weekly Candle: I am strictly looking for long positions (buys).
- Red Weekly Candle: I am strictly looking for short positions (sells).
This is my “compass.” If the previous week closed red, my mindset for the following week is bearish. However, I never enter blindly. I use the Relative Strength Index (RSI) as an exhaustion filter. If the weekly RSI is above 60 or 70, I refuse to open long positions, even if the candle is green. Why? Because the statistical probability of a mean reversion or a correction is significantly higher than a continued breakout in an overbought scenario.
The Multi-Timeframe Alignment (Weekly + 4H)
The actual “trigger” happens on the 4-hour (4H) chart. If the weekly trend is bearish (red candle), I drop down to the 4H timeframe and wait for it to also present red candles. I only enter when both timeframes are perfectly aligned. If the 4H chart starts showing green candles in a bearish weekly environment, I cease all entries and wait for the “tide” to turn back in favor of the macro trend.
4. The Taboo: Why the Stop Loss is Obsolete in My Portfolio
This is where we enter territory that makes market purists do a double-take: I do not use a conventional stop loss. Traditional education teaches that the stop loss is your insurance, but in the reality of the 2026 Forex market—a high-liquidity, cyclical environment—the stop loss often serves as nothing more than a tool to “flush out” weak hands before the real move occurs.
I firmly believe that the Stop Loss is obsolete when you possess professional volume management. Instead of accepting a definitive loss when the market touches an arbitrary point on a chart, I utilize Hedging (the “Edge”).
The Hedging Technique as a Safety Net
If a EUR/USD position accumulates a floating drawdown exceeding 2.5% of my total capital, I do not close the trade in red. Instead, I open an opposing position (a hedge) to lock in the current loss and neutralize further movement.
From that point on, my job shifts from “predicting” the price to managing the recovery. I use the profits generated by the hedge position during corrections to systematically “buy back” and close out the initial losing positions. It is a game of patience and mathematics. Because the market is cyclical, the price will eventually return to levels where I can release the capital without the catastrophic damage of a poorly placed stop loss.
5. EUR/USD 2026 Outlook: The Current Landscape
Looking at the current charts (mid-January 2026), we see the EUR/USD trading near 1.1629. We are currently confined within a long-term descending channel.
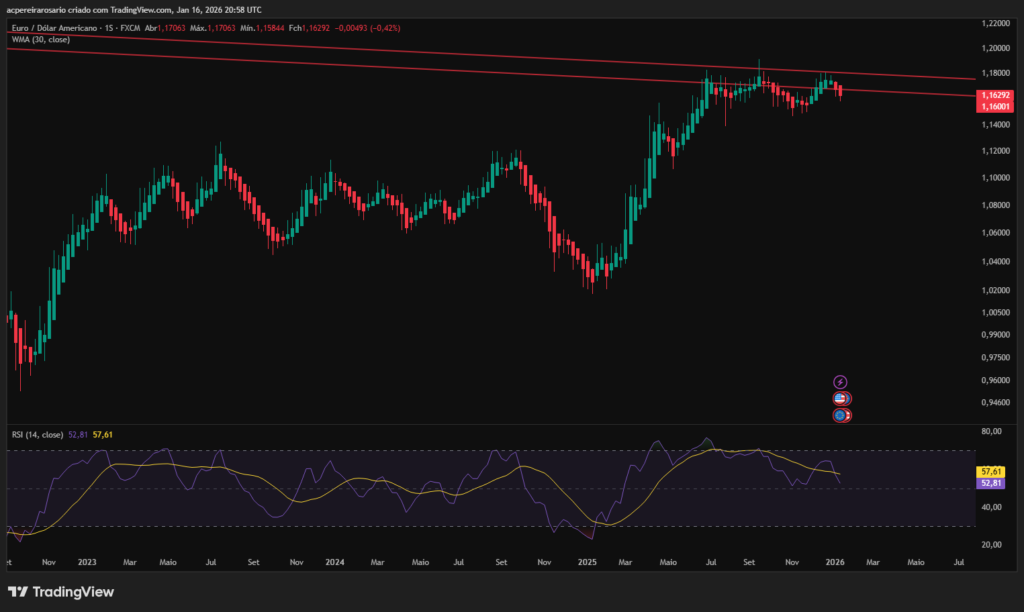
On the weekly chart, the RSI is hovering between 52 and 57, indicating a neutral-to-bearish bias. Currently, my focus is exclusively on short positions (selling). I believe the pair has room for a deeper correction before any serious attempt to break the upper resistance of the channel. As long as weekly candles remain under the pressure of the 30-period Weighted Moving Average (WMA 30), the path of least resistance is decidedly downward.
FAQ: Frequently Asked Questions
H3: Is it really safe to trade without a stop loss?
Only if you use miniscule proportional volumes (micro-lots) and have a rigorous hedging plan in place. Without strict volume management, trading without a stop loss is a fast track to account liquidation.
H3: What is the best timeframe for this strategy?
The “Master” timeframe is the Weekly chart for direction and the RSI filter. The “Executor” is the 4-Hour chart for timing entries based on candle color alignment.
H3: Does this strategy work for Stocks or Crypto?
I do not recommend it. Indices like the S&P 500 have an inherent upward bias and lack the cyclicality of Forex. Bitcoin’s volatility can blow through a hedge before you can react. This strategy was designed specifically for the Forex cyclicality.
H3: What if the market goes on an infinite trend against me?
In Forex, “infinite trends” are rare due to purchasing power parity. However, in extreme cases, structured hedging and using profits from other currency pairs to offset the drawdown is the only technical exit.
Conclusion: The Supremacy of Management Over Prediction
To conclude, my 2026 Forex trading strategy does not attempt to be clever; it attempts to be resilient. By accepting that the market is random, I remove the psychological burden of having to be “right.” I don’t need to be right about the next move of the EUR/USD; I only need to be prepared for whatever direction it takes.
The use of micro-lots, weekly color alignment, and the replacement of the stop loss with strategic hedging allows me to sleep soundly, knowing that historical cyclicality is working in my favor. If you want to succeed in this market in 2026, stop searching for the perfect indicator and start focusing on the mathematics of your exposure.
Disclaimer: The content of this article is for informational purposes only and reflects my personal opinion based on market experience. Forex trading involves high risk and should not be conducted with capital you cannot afford to lose. Past performance is not indicative of future results.