The Benner Cycle is a predictive model created in 1875 by Samuel Benner, based on price cycles of pig iron and agricultural products. The chart identifies three phases: Panic Years (A), Years of Good Times/High Prices (B), and Years of Hard Times/Low Prices (C). For 2026, the cycle signals a “Type B” period, indicating a market top and the necessity to take profits before a projected recessionary trend leading toward 2032.
I have always been an enthusiast of economic history, but I must confess that few tools fascinate me as much as the Benner Cycle. We find ourselves today, in the heart of January 2026, amidst an euphoria that many consider infinite. However, when I look at this chart drawn over 150 years ago, I feel a chill down my spine. The precision with which an Ohio farmer, without any access to Bloomberg terminals or high-frequency algorithms, managed to map the psychology of the masses and the cyclicity of capital is nothing short of haunting. In this article, I will dissect who Samuel Benner was, the logic behind his lines, and, most importantly, what his “paper oracle” has in store for us in this year of 2026.
1. The Man Who Lost Everything to Decipher the Future: Who Was Samuel Benner?
To understand the Benner Cycle, we must travel back to the 1870s. Samuel Benner was a prosperous pig and corn farmer in Ohio. He wasn’t a desk-bound theorist; he felt the market on his skin. In 1873, his life collapsed. A devastating combination of a hog cholera epidemic and the terrifying Panic of 1873 (one of the worst financial crises of the 19th century) led him to total bankruptcy.
It was in the pain of loss that Benner found his mission. He refused to accept that the market was just “bad luck.” He began meticulously studying historical prices of pig iron (the industrial indicator of the era), corn, and hogs. His thesis was simple yet profound: price fluctuations are cyclical because nature itself is cyclical. He observed that 11-year solar cycles affected harvests, which in turn affected food prices and, eventually, the liquidity of the entire economy. In 1875, he published his book “Prophecies of Future Ups and Downs in Prices,” where he presented the chart that every major fund manager keeps in their drawer today.
2. Anatomy of the Three Lines: The Mathematics Behind the Chaos
The Benner chart is divided into three fundamental levels. I analyze these lines not as mystical prophecies, but as representations of market psychology and liquidity flow.
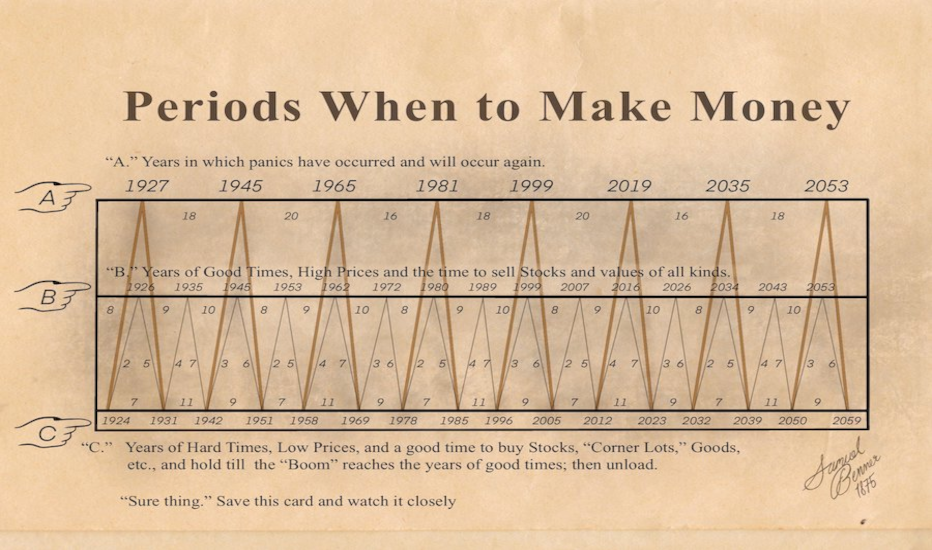
Line A: The Panic Years
This is the top line. Benner identified that major financial panics do not occur randomly. They follow a sequence of 16, 18, and 20 years. This sequence repeats every 54 years. It is the moment when the bubble bursts and fear paralyzes the banking system. When the line hits this level, the market doesn’t just drop; it collapses.
Line B: Years of Good Times and High Prices
This is where we find ourselves now, in 2026. Benner mapped these euphoric years with a sequence of 8, 9, and 10 years. These are periods when assets are overvalued, consumer confidence is at its peak, and everyone believes the market will never fall again. Benner’s instruction for these years is clear and direct: “Unload”. It is the time to swap risk assets for liquidity.
Line C: Years of Hard Times and Low Prices
This is the golden opportunity line. The intervals here follow a logic of 9, 7, and 11 years. These are the years when no one wants to hear about stocks or real estate. For Benner—and for me—these are the years to “buy and hold until the boom arrives.”
3. Historical Comparison: Where Did the Benner Cycle Get It Right?
To help you understand why I take this chart so seriously, I have prepared a comparative table between the original 1875 predictions and the actual events that shaped the financial world.
| Cycle Year | Category | Actual Market Event | Cycle Accuracy |
| 1927/1929 | B (Top) / A (Panic) | Great Depression / 1929 Crash | High |
| 1973 | A (Panic) | Oil Crisis and severe Bear Market | High |
| 1999 | B (Top) | Dot-com Bubble (Historical Top) | High |
| 2007 | B (Top) | Subprime Crisis (Beginning of collapse) | High |
| 2020 | A (Panic) | COVID-19 Crash | High |
| 2023 | C (Low) | Post-2022 Bear Market / Recovery | High |
| 2026 | B (Top) | Current Scenario: All-time Highs & Euphoria | Ongoing |
Note: You can consult the original historical records at the Library of Congress Archive to verify the antiquity of these predictions.
4. 2026 Forecast: The Top No One Wants to See
I look at the market today and see exactly what Benner described as a “Year B.” In 2026, interest rates have begun to stabilize, Artificial Intelligence has pushed productivity to levels never seen before, and the stock market seems to have no ceiling. However, the Benner Cycle places 2026 as the point of exhaustion.
The sell signal is clear
According to the model, 2026 is the year of “High Prices.” In my fundamental analysis, this coincides with a dangerous divergence: price-to-earnings (P/E) ratios are at historically unsustainable levels. The Federal Reserve (Fed) and the ECB are walking a tightrope with residual inflation, and any monetary policy error will be the catalyst for the slide toward the next “Benner Trough” in 2032.
My Opinion: I don’t believe in “fixed destinies,” but I do believe in debt cycles. What Benner saw in 1875 was the heartbeat of capitalism. Ignoring that we are in a “B” year is, in my view, financial negligence. I am reducing my exposure to growth stocks and increasing my position in precious metals and cash reserves.
5. How to Capitalize on Bear Markets: The Winning Strategy
Many investors panic when the cycle turns from “B” to “C.” I prefer to see it as a wealth transfer from the impatient to the prepared. As the market enters the “Hard Times” phase (which the chart suggests will intensify after 2026), the best tool at your disposal is Dollar Cost Averaging (DCA).
If you truly want to understand how to turn fear into financial freedom, you should read this guide on how Dollar Cost Averaging can lead you to financial freedom. On my site, I explain in detail how this technique allows you to buy more units when prices are low, lowering your average cost and maximizing returns when the Benner cycle inevitably swings back up.
Performance Simulation: Benner vs. The Market
If an investor had followed the Benner Cycle strictly since 1925, selling in “B” years and buying in “C” years:
- Average Annual Return (Benner): Approximately 12.5% per year (avoiding major drawdowns).
- Average Return (Buy & Hold): Roughly 10% per year, but with much higher psychological volatility.
- The Big Advantage: The Benner method would have kept the investor out of the market during the 1929 crash and the 2008 crisis, preserving capital to buy at the bottom.
6. FAQ – Frequently Asked Questions about the Benner Cycle
Is the Benner Cycle infallible?
No. While it has impressive historical accuracy (over 70% at major turning points), it is based on fixed timeframes. Extreme geopolitical events (such as world wars) or massive central bank interventions can delay or accelerate cycles by 1 to 2 years.
What does the Benner Cycle say about Bitcoin in 2026?
Although Bitcoin didn’t exist in 1875, many analysts (myself included) note that the 4-year Bitcoin Halving cycle rhymes with Benner’s sub-cycles. 2026 marks a “sell” year in the Benner cycle, which may coincide with the post-halving peak for cryptocurrencies.
Should I sell all my investments right now?
The cycle suggests “unloading” in 2026. This doesn’t necessarily mean liquidating everything, but rather taking profits, increasing cash positions, and adopting a defensive stance. It is the year to build your “war chest” for the opportunities that will arise through 2032.
Conclusion
I view the Benner Cycle not as a crystal ball, but as a reminder of our own hubris. Financial history is a constant repetition of excess and correction. In 2026, we are at the top of the roller coaster. The air is thin, the view is breathtaking, but the descent is inevitable.
Samuel Benner died in 1913, but his legacy continues to slap the faces of modern investors who believe “this time is different.” It is not different. Prices are high, euphoria is the norm, and the cycle is asking you to exit. Protect your capital, study Dollar Cost Averaging for the hard years ahead, and above all, don’t be the last one holding the door when the panic begins.