In January 2026, the TLT (iShares 20+ Year Treasury Bond ETF) represents the most significant asymmetric opportunity in the global market. With real-time inflation (Truflation) at 1.70%—well below the Fed’s target—and record-breaking short interest, a transition into a deflationary era is inevitable. Falling yields will aggressively drive up long-term bond prices. Coupled with equity market volatility and a “risk-off” rotation, the stage is set for a massive short squeeze and a generational rally in U.S. debt.
I am looking at the capital markets in January 2026, and the conclusion I’ve reached is unavoidable: we are on the precipice of witnessing one of the most violent and profitable moves in American fixed income in decades. If you’ve been following my analysis, you know that my core thesis for this year is built upon the definitive transition into a deflationary era, a concept I explored in depth in my previous article on CPI predictions and the onset of the deflationary age. However, what many market participants have yet to grasp is how the TLT has become the perfect vehicle to capitalize on this macroeconomic paradigm shift.
I firmly believe the market consensus is wrong—again. While the majority spent 2025 fearing “sticky” inflation, the leading indicators suggest a starkly different reality. I don’t just look at the lagging reports from the Bureau of Labor Statistics (BLS); I look at real-time inflation data. And what I see is a generational entry point for those brave enough to go against the herd.
1. The Harsh Reality of Deflation: Why Consensus is Wrong
To understand why I am heavily positioned in the TLT, we must first accept that inflation, as we knew it, is dead. Contrary to official government reports that often suffer from a significant time lag, the Truflation US CPI index shows us today, January 15, 2026, a real-time inflation rate of 1.70%. This is substantially lower than the 2.70% figure still being touted by the BLS.
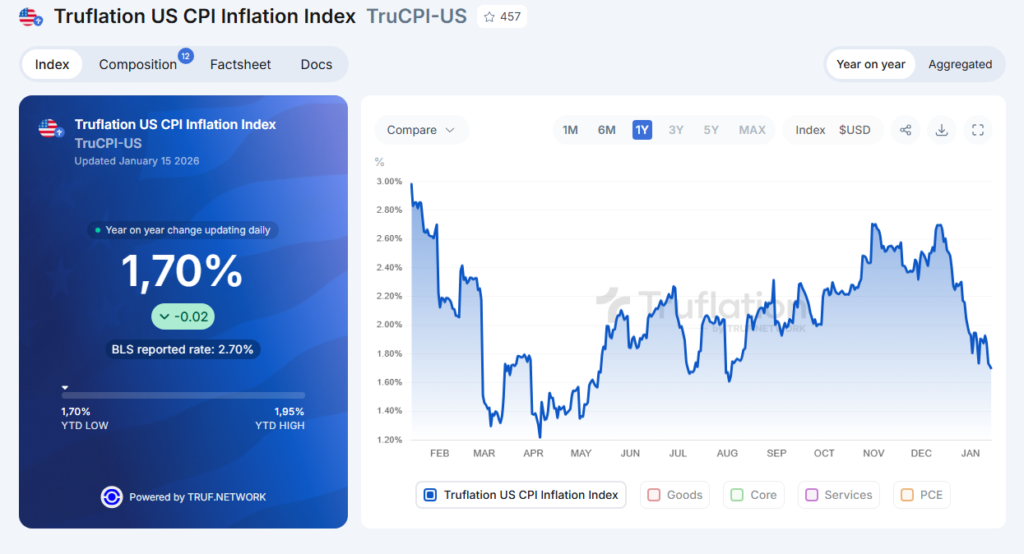
This divergence is not merely a technical detail; it is the bedrock of my entire investment thesis. We are living through a period where oversupply, rapid advancements in Artificial Intelligence (AI), and a cooling labor market are structurally suppressing prices. When real inflation sits below the Federal Reserve’s 2% mandate, the monetary authority has no choice but to cut interest rates aggressively to prevent a debt-deflationary spiral.
I view this scenario as the “primary fuel” for the TLT engine. If short-term rates fall, the entire yield curve must eventually adjust. This is where the “magic” of 20+ year bonds happens. As an analyst, I see the Fed moving from a “higher for longer” stance to a “lower, faster” reality as they realize they have overshot their tightening cycle.
2. Fixed Income Mechanics: Yields vs. Prices (The Coupon Surge)
Many retail investors remain confused by the inverse relationship between interest rates and bond prices. Let me break down this process clearly, as it is the cornerstone of my strategy: when yields (market interest rates) fall, the price of the bond (and the TLT ETF value) rises.
The TLT holds U.S. Treasury bonds with long-term maturities. These securities possess high “duration,” meaning they are exceptionally sensitive to interest rate fluctuations. In the world of fixed income, the price of a bond ($P$) can be simplified by the following relationship:
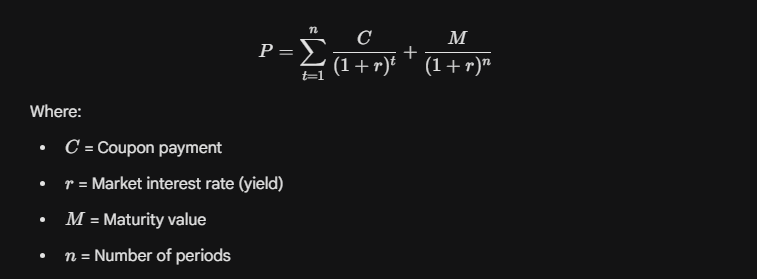
As the denominator (1+r) decreases because market rates are falling, the present value (P) of the bond increases. Because the TLT focuses on the 20-year+ segment, n is very large, making the price response to rate changes almost parabolic. Currently, long-term yields are hovering around 5%. If my deflationary forecast holds and rates retreat toward 3% or 3.5%, we are looking at a potential capital appreciation of 20% to 30% in the ETF price alone—excluding the monthly dividends you collect while waiting. It is the ultimate “win-win”: you capture capital gains and a high-yield coupon simultaneously.
3. The US10Y as a Safe Haven: The Port in the Storm
We cannot ignore that 2026 is proving to be a year of extreme uncertainty in equity markets. The Benner Cycle, which historically anticipates market corrections every 4-5 years, suggests we are in a period of lateral movement or a full-scale “bear market of minor degree” for Wall Street.
I maintain the position that during an equity correction, capital will inevitably flee toward safety. There is no greater safety net in the financial universe than U.S. Government debt. The US10Y (10-Year Treasury Note) will act as the ultimate safe haven. When global investors panic and rush to buy debt, yields collapse due to the law of supply and demand, catapulting the price of duration-sensitive assets like the TLT, US05Y, and US02Y.
In my view, we are entering a “Risk-Off” regime. The excessive valuations in AI-driven tech stocks are finally facing the gravity of slowing earnings growth. As the S&P 500 enters a period of high volatility, the bond market will once again become the “ballast” of the global portfolio.
4. The 2026 Dollar Paradox: Why the DXY Will Rise Despite Falling Rates
Here is the most counterintuitive part of my analysis, what I call “The Dollar Paradox of 2026.” Traditional economic theory suggests that lower interest rates should weaken a currency. However, I believe the DXY (US Dollar Index) is headed for new highs, as I explained in my recent article on why falling rates will skyrocket the DXY and how I’m positioned.
In a global deflationary and unstable environment, the U.S. Dollar is not just a currency; it is a global liquidity reserve. As the demand for U.S. Treasuries (the components of TLT) increases, foreign investors are forced to buy dollars to acquire these assets, creating relentless upward pressure on the DXY. For me, being long TLT in 2026 is a masterstroke: you benefit from the rise in bond prices and the underlying strength of the world’s reserve currency.
5. The Sleeping Giant: Technical Analysis and the Mother of All Short Squeezes
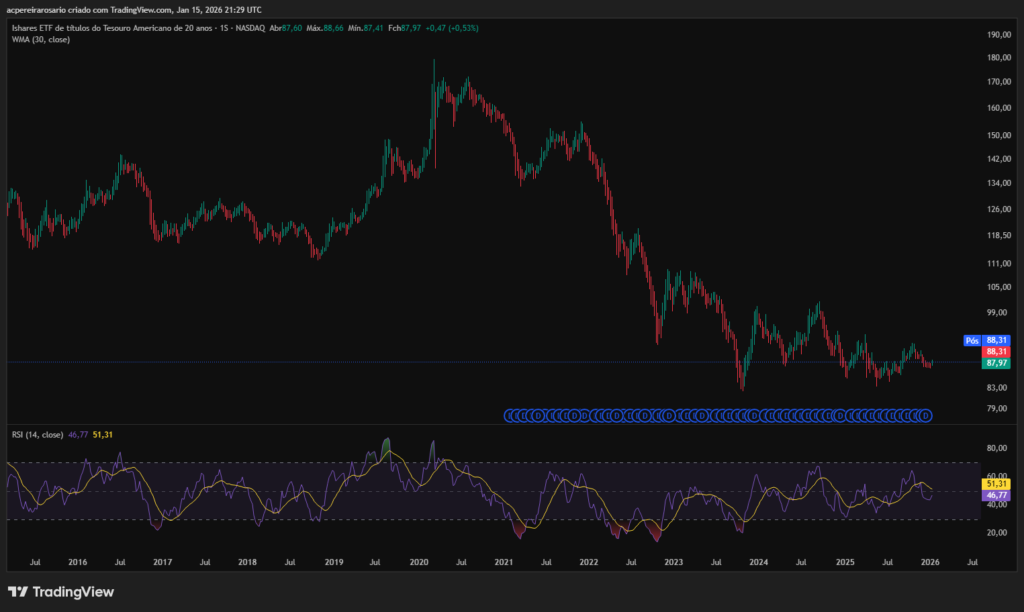
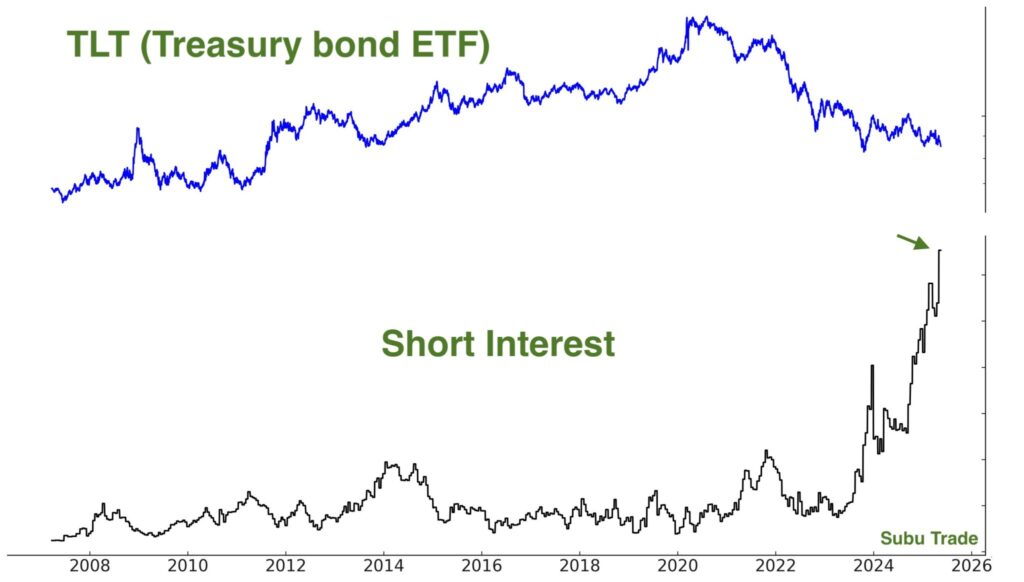
When we look at the technical charts, the setup for the TLT is nothing short of explosive. Examining the data provided, we see the asset trading in the $87.00 – $89.00 range, with an RSI showing clear bullish accumulation patterns. But the metric that truly excites me is the Short Interest.
We are witnessing record-breaking short positions in U.S. Treasuries. Thousands of institutional investors and hedge funds are “shorting” the long end of the curve, betting on an inflationary debt spiral. They are about to be steamrolled by reality.
Anatomy of the TLT Short Squeeze
A short squeeze occurs when a heavily shorted asset begins to rise, forcing those who bet against it to buy back shares to cover their losses, which in turn accelerates the price increase. Imagine what happens when the largest market in the world (the debt market) decides to evict the “bears”:
- The Catalyst: The Fed signals the first major rate cut due to deflation (confirmed by Truflation at 1.7%).
- The Breakout: TLT breaks its long-term descending trendline (which we see in the Wyckoff accumulation phase on the chart).
- The Panic: Short-sellers, caught off guard by the safe-haven bid and falling yields, begin to close their positions.
- The Result: The upward move becomes parabolic as the market realizes the “recession/deflation” trade is the only game in town.
I have no doubt that this record-short positioning is the greatest tactical error of 2026, and I am positioned to profit from their oversight.
6. Comparative Debt Asset Table (January 2026)
To help you navigate these waters, I have prepared this comparison table of the assets I am currently monitoring for this trade:
| Asset | Maturity | Risk Profile | Potential Gain (Price) | Est. Current Yield | Core Thesis Objective |
| TLT | 20+ Years | Medium/High (Volatility) | 20% – 30% | 4.8% – 5.1% | Maximize Short Squeeze and long-end rate collapse. |
| US10Y | 10 Years | Medium | 10% – 15% | 4.5% | Standard safe-haven play against SP500 correction. |
| US05Y | 5 Years | Low/Medium | 5% – 8% | 4.2% | Stability with an attractive carry (coupon). |
| US02Y | 2 Years | Low | 2% – 4% | 4.0% | Capture the immediate Fed pivot on the short end. |
Note: The TLT remains my preferred choice due to its superior convexity and extreme sensitivity to the disinflationary trend.
7. Fiscal Dominance and the 2026 Fed Mandate
It is crucial to address the reality of “Fiscal Dominance” in 2026. The U.S. government is facing a colossal “wall of maturities”—billions of dollars in debt that must be refinanced this year. As a senior analyst, I see that the political pressure on the Federal Reserve to lower rates and reduce the cost of servicing this debt is immense.
The administration has a direct interest in keeping financing costs low to avoid a primary deficit explosion. This reinforces my conviction that yields have nowhere to go but down, regardless of any “hawkish” rhetoric we might hear in press conferences. The Fed is effectively trapped, and their only escape route is to allow rates to fall in tandem with the deflationary reality.
Frequently Asked Questions (FAQ)
Is TLT safe if U.S. national debt continues to grow?
Yes. In a deflationary environment, debt becomes more burdensome in real terms, which eventually forces the Fed to intervene with asset purchases (QE). This intervention directly supports bond prices, making TLT a primary beneficiary of “debt stress.”
What is the difference between buying TLT and buying individual Treasury bonds?
TLT offers immediate liquidity and a constant maturity profile (it constantly rolls its holdings to stay in the 20+ year range). It is a superior trading and speculation tool for capturing price movements compared to holding a single bond to maturity.
What could invalidate this bullish thesis for TLT?
Only an unforeseen, massive external inflationary shock (such as a total collapse in global oil supply) that would prevent the Fed from cutting rates despite the economic slowdown. However, with oil prices falling and AI driving down costs, I view this risk as minimal in 2026.
Conclusion: My Final Stance
In summary, investing in TLT, or even its shorter-duration cousins like US05Y and US02Y, is not merely a defensive move in 2026; it is an aggressive strategic play to capture what I believe is the most significant trend reversal of the decade.
The combination of real-time deflation at 1.70%, an unprecedented short squeeze potential, and the fiscal necessity of the Fed creates a “perfect storm” for bond bulls. I have already taken my position. I am ignoring the noise of the mainstream media and focusing on the hard data. If history has taught us anything, it is that the greatest fortunes are made when you bet against a stretched consensus at the exact moment the macroeconomic tide turns.
Get ready for the liftoff, because when the TLT squeeze begins, most will be left staring at the chart, wondering how they missed the trade of the century.
Disclaimer: This article represents my personal opinion and market analysis as of January 15, 2026. It does not constitute personalized financial advice. Investing in capital markets, specifically long-duration bond ETFs like the TLT, involves significant risks related to volatility and capital loss. You should consult with a qualified financial advisor before making any investment decisions.